Transform your search engine marketing reporting from a data dump into a strategic asset. Learn to build actionable reports that drive real business growth.
Great search engine marketing reporting does more than just present numbers; it tells a clear story about business impact. It connects every dollar spent on campaigns directly to outcomes that matter. We need to move past surface-level metrics like clicks and impressions and zero in on key performance indicators (KPIs) that actually reflect business goals, like Return on Ad Spend (ROAS) and Cost Per Acquisition (CPA).
Building Your SEM Reporting Foundation
Before you even think about building a dashboard or designing a chart, you have to lay a solid foundation. Honestly, this is the most critical part of the whole process. It's where you align your marketing work with real business objectives.
If you skip this, you’ll end up with reports that are packed with data but completely meaningless. It’s the classic "data dump"—it overwhelms stakeholders, doesn't lead to smart decisions, and ultimately, makes your work look ineffective.
The entire principle is to translate what the C-suite cares about into specific, measurable SEM KPIs. This ensures every single metric you track has a purpose and adds to the larger narrative of your marketing's value.
From Business Goals to Actionable KPIs
The first hurdle is getting past vague goals like "increase traffic." Think about it: a B2B tech company doesn't just want more website visitors. They need qualified leads that their sales team can actually close. This is where truly powerful reporting starts to take shape.
Let’s walk through a real-world scenario. A SaaS company’s main goal is to increase its market share. That's a big, high-level objective. We need to break it down into tangible marketing goals:
- Objective 1: Generate More Demo Requests. This is a direct, bottom-of-the-funnel action. The obvious primary KPI here is Cost Per Acquisition (CPA) or maybe Cost Per Qualified Lead (CPQL). You’re measuring how efficiently your ad spend is generating high-intent leads.
- Objective 2: Build Brand Authority. This is more of an upper-funnel play. Here, your KPIs would shift to things like Impression Share on non-branded, problem-aware keywords and the Click-Through Rate (CTR) on ads promoting thought leadership content.
This translation process is absolutely fundamental. Having a clear framework like this stops you from chasing vanity metrics and keeps your reporting laser-focused on what moves the needle for the business. While the structure might feel similar to what you’d build for a standard SEO report, the focus on direct ad spend and immediate return is much sharper in SEM.
The table below offers a practical look at how you can bridge this gap between business objectives and the metrics you track daily.
Translating Business Goals into SEM KPIs
A practical guide to aligning high-level business objectives with specific, measurable SEM key performance indicators.
This framework isn't just about picking metrics; it's about creating a shared language between your marketing team and company leadership, ensuring everyone understands how SEM activities contribute to success.
Selecting the Right Metrics for the Job
Not all KPIs are created equal, and their importance really depends on what a specific campaign is trying to achieve. You wouldn't judge a brand awareness campaign on its ROAS, just as you wouldn't judge a direct-response campaign primarily by its impression volume.
A common mistake is applying a one-size-fits-all measurement strategy to all SEM activities. The most effective reports are segmented, telling a different story for each part of the marketing funnel and demonstrating how each contributes to the overall business objective.
This strategic selection is crucial, especially when you consider the market we operate in. Google's dominance is staggering; the search giant commands 89.66% of the global market share. This means your reporting absolutely must prioritize metrics from Google Ads and Google Analytics as your primary sources of truth for SEM success.
And with mobile now accounting for 62.73% of all website traffic, understanding performance on that platform within Google's ecosystem is non-negotiable for anyone building a serious reporting framework.
Connecting the Dots with Integrated Data
Your SEM reporting is only as good as the data feeding it. If you're pulling numbers from separate, disconnected platforms, you're not getting the full story—you're just looking at scattered pieces of a puzzle. To get a clear, accurate picture, you need to create a single source of truth that connects everything.
The goal here is to build a solid data pipeline. This means seamlessly linking your ad platform (like Google Ads), your website analytics (Google Analytics 4), and your CRM system. Only then can you trace a customer’s entire journey, from that first ad click all the way to their lifetime value sitting in your CRM.
Building Your Data Pipeline
So where do you start? The first practical step is to link your core platforms. The integration between Google Ads and GA4 is non-negotiable. It allows you to import audiences and conversion events, which is critical for sharpening your targeting and enabling smarter bidding strategies.
The real game-changer, though, is bringing your CRM into the mix. Think about importing offline conversion data—like when a sales rep marks a deal as "closed-won" in Salesforce. By feeding that revenue data back into Google Ads, you stop optimizing for simple lead forms and start optimizing for actual, bottom-line revenue. This is how you close the loop and prove your ad spend is directly contributing to business growth.
This entire process reinforces a fundamental principle: a business goal dictates your KPI, which in turn drives a measurable business outcome.
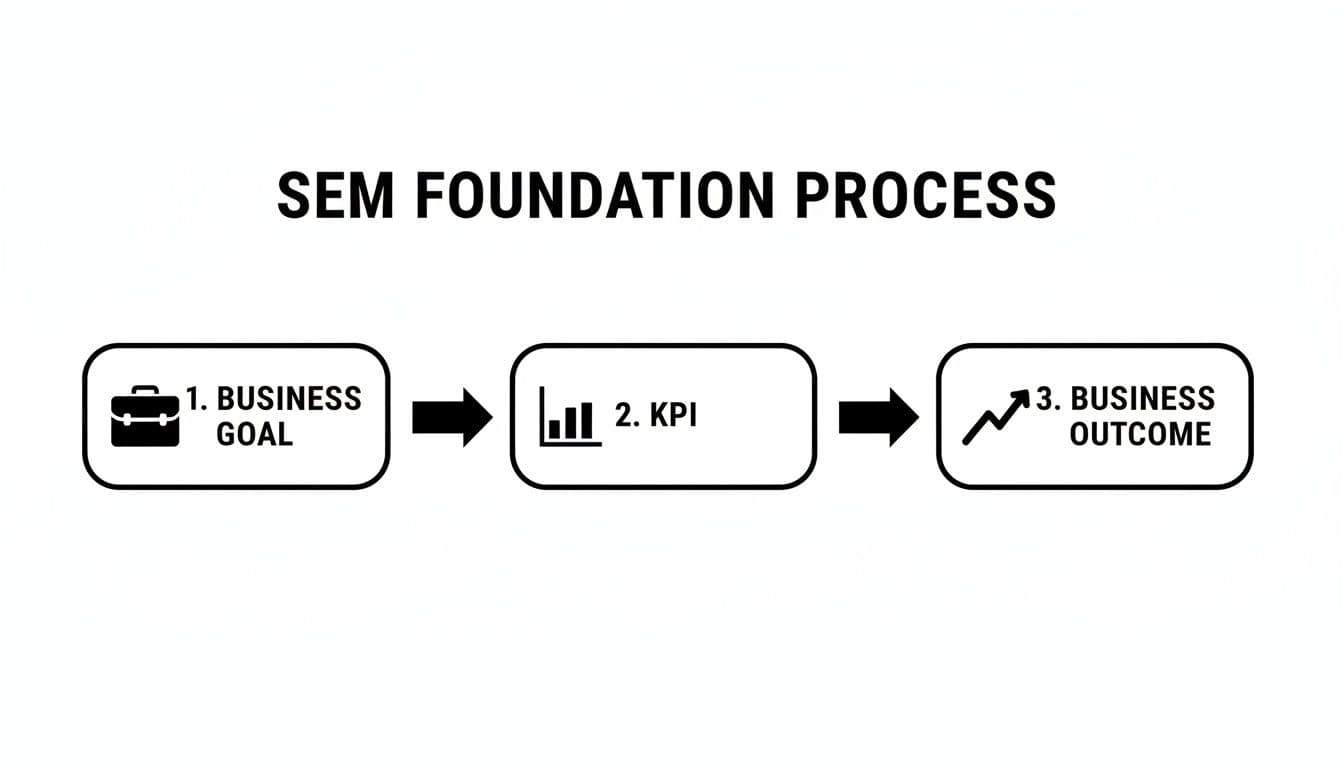
This simple flow is a constant reminder that every metric you track should be directly tied to a strategic objective. If it's not, it's just noise.
Moving Beyond Last-Click Attribution
Once your data is integrated, you can finally break free from the deeply flawed last-click attribution model. Last-click gives 100% of the credit to the final touchpoint before a conversion, completely ignoring every other ad, click, and interaction that guided the customer along the way.
Imagine this common scenario: a customer first finds your brand via a non-branded search ad. A week later, they see a remarketing ad. Finally, they type your brand name into Google, click the branded ad, and make a purchase. Last-click would incorrectly tell you that only your branded search campaign is working, which might lead you to slash the budget for the very top-of-funnel campaigns that are bringing you new customers in the first place.
Relying on last-click is like giving all the credit to the cashier for a sale, ignoring the marketing, product displays, and brand reputation that brought the customer into the store.
A much smarter approach is to use data-driven attribution (DDA). This model uses machine learning to analyze both converting and non-converting paths, distributing credit far more accurately across the entire customer journey. It gives you a realistic view of how your campaigns actually work together. For a deeper dive, it's worth learning more about measuring marketing campaign effectiveness and how different touchpoints contribute to the end result.
Setting Up Meaningful Conversion Tracking
Great reporting demands that you track every meaningful action a user can take. Don't just focus on the final sale; you need to track both your primary goals (macro-conversions) and the smaller steps that lead up to them (micro-conversions).
Here’s how to think about them:
- Macro-Conversions: These are your ultimate business objectives. For an e-commerce site, this is a purchase. For a B2B SaaS company, it's likely a demo request.
- Micro-Conversions: These are smaller, yet crucial, actions that signal engagement. Think newsletter sign-ups, whitepaper downloads, or video views.
Tracking micro-conversions is key to understanding the full impact of your SEM efforts. It helps you see the value in upper-funnel campaigns that build awareness but might not drive immediate sales. By assigning a value to these smaller actions, you can better justify your budget and paint a complete picture of your marketing performance.
Designing Dashboards That Get Used
Let’s be honest: raw data is overwhelming. An effective SEM reporting dashboard does more than just spit out numbers; it translates all that complex data into clear, insightful visuals that actually help you make better decisions. The real goal is to build something your stakeholders want to use because it makes their jobs easier.
This isn't just about making things look pretty. It's about designing for clarity and purpose. A great dashboard can be the difference between a team that’s always playing catch-up and one that’s proactively steering the ship toward success.
Choosing the Right Dashboard Tool
First things first, you need to pick your platform. The market is full of options, from free and accessible tools to heavyweight, enterprise-grade business intelligence (BI) platforms. The right choice really comes down to your budget, your team's technical chops, and what you need to report on.
- Google Looker Studio (formerly Data Studio): This is the go-to for most marketers, and for good reason. It’s free, it plays nicely with the entire Google ecosystem (Ads, Analytics, Sheets), and the learning curve isn't too steep. It’s perfect for creating solid, shareable dashboards for the vast majority of SEM campaigns.
- Advanced BI Platforms (Tableau, Power BI): These are the big guns. They offer way more power and flexibility, connecting to pretty much any data source you can think of (databases, cloud services, you name it). But all that power comes with a much steeper learning curve and a significant price tag.
For most teams just getting serious about their SEM reporting, Looker Studio is the perfect place to start. It gives you more than enough firepower without the cost and complexity of a full-blown BI solution.
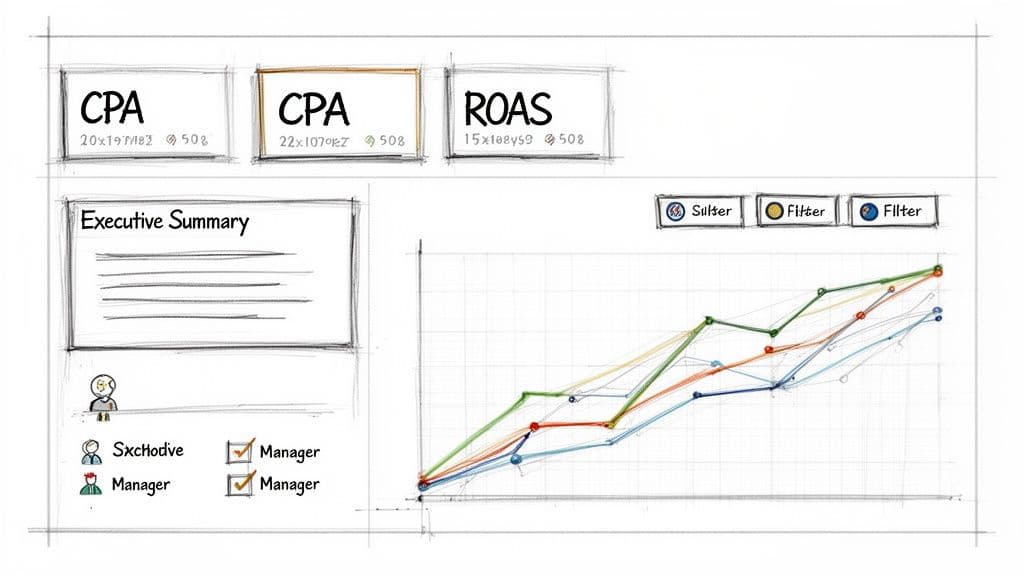
Tailoring Dashboards for Different Audiences
A one-size-fits-all dashboard almost never works. Your CEO and your campaign manager are looking for completely different things in the data to do their jobs. Building audience-specific dashboards is the key to making sure they actually get used.
The Executive Summary (For Leadership)
This view is all about the big picture and the bottom line. It needs to be clean, straight to the point, and quickly answer the question, "Is our investment paying off?"
- Focus: High-level, business-critical KPIs.
- Key Metrics: Overall ROAS, CPA, Total Ad Spend, and Total Revenue/Leads.
- Visualization: Keep it simple. Use scorecards for the big numbers and trendlines to show performance month-over-month or quarter-over-quarter.
- Layout: One single, uncluttered screen. That’s it.
The cardinal rule for an executive dashboard is "insights, not data." Leadership needs to grasp the business impact in under 60 seconds. If they have to hunt for the takeaway, the dashboard has failed.
The Campaign Manager Deep-Dive (For Practitioners)
This dashboard is the command center for the marketing team. It has to be granular, interactive, and built to help managers spot opportunities and fix problems on the fly.
- Focus: Tactical, campaign-level performance.
- Key Metrics: CTR, CPC, Conversion Rate, Quality Score, Impression Share, and breakdowns by keyword, ad group, and device.
- Visualization: Detailed tables with filters are a must. Add in some heat maps and charts that let you drill down into specific date ranges or segments.
- Layout: This can be a multi-page report, maybe organized by campaign type like Brand, Non-Brand, and Shopping.
When you're looking for ways to make your dashboards truly useful, it helps to see what others have done well. You can find some great ideas by checking out these inspiring business intelligence dashboard examples.
Automating Your Reporting Workflow
The real magic happens when your dashboard runs on its own. Manual reporting is a soul-crushing, error-prone task that pulls you away from actual strategic work. Setting up automated reporting workflows means your stakeholders get the latest data delivered right to them, on a schedule they can count on.
Most tools, Looker Studio included, let you schedule email deliveries of your reports as PDFs. This simple feature transforms your dashboard from a link someone has to remember to click into a proactive piece of communication.
- Set the Schedule: Send the executive summary on the first Monday of the month. The campaign manager’s deep-dive? Send it every Monday morning to set the tone for the week's optimizations.
- Add Some Context: Don't just send a file. Use the email body to add a quick summary or call out a key insight. A single sentence like, "Check out the 15% jump in ROAS for our Q4 campaign," adds immediate value.
- Drive Action: Always link back to the live, interactive version of the dashboard so people can dig in if they want to.
By automating, you build a steady rhythm of communication and accountability. Of course, great data visualization is only one piece of the puzzle. It works best when paired with smart CRO, which ensures the traffic you're reporting on has the best possible chance to convert. For more on that, check out our guide on conversion rate optimization best practices.
Weaving a Narrative with Your Data
The best SEM reports do more than just dump data onto a page; they tell a story. A report packed with metrics but missing a clear narrative is just noise. The real magic happens when you transform raw numbers into a compelling story that explains what happened, why it happened, and what we should do about it.
This is the essence of data storytelling. It’s about moving beyond a simple list of your ROAS and CPA. Instead, you build a report that intentionally guides your stakeholders—your boss, your client, your team—toward a specific, insightful conclusion. A well-told story makes your findings stick and gives everyone the confidence to make smart, data-backed decisions.
Start with the Conclusion
It feels backward, but the most effective reports lead with the final takeaway. Executives and busy stakeholders simply don't have the time to wade through charts and tables to figure out the point. You have to give them the headline right at the top.
Think like a journalist writing a news story. Get straight to the point.
- A weak, passive opening: "This month, Campaign A had a CPA of 50, Campaign B had a CPA of 75, and Campaign C had a CPA of $45."
- A strong, insightful opening: "Campaign C drove our most efficient leads this month at a $45 CPA, beating our target by 10%. My recommendation is to reallocate 20% of Campaign B's budget to scale the top-performing ad group within Campaign C."
This approach immediately orients your audience. The rest of your report then becomes the evidence backing up your initial claim, making the entire thing easier to follow and far more persuasive.
Add Commentary to Explain the "Why"
Numbers tell you what happened. Your expert commentary is what explains why it happened. This is where you, the analyst, add the critical context that turns raw data into actual business intelligence. A sudden drop in conversion rate isn't just a random data point; it's an event with a cause that you need to uncover and explain.
Never assume the data speaks for itself. It doesn't. Your job is to add your analysis to guide the reader’s interpretation.
A dip in performance isn't a failure—it's a documented learning opportunity. Your commentary should frame these events as insights that will lead to a stronger, more informed strategy, not as problems.
For instance, if you notice a sudden spike in CPC, your commentary needs to dig in. Did a new competitor just jump into the auction? Did a handful of keywords see their Quality Scores drop? Is this a predictable seasonal trend? Answering these questions in your report is what elevates it from a simple data summary to an indispensable strategic tool. You’re not just reporting the numbers; you're managing the narrative and proving your strategic value.
Structure Your Narrative Arc
Once you’ve got your main conclusion and the "why" behind it, the next step is to structure the report to support your story. A simple yet incredibly powerful narrative structure for SEM reporting follows this flow:
- The Headline: Start with your main conclusion, as we just covered. Hit them with the key takeaway first.
- The Supporting Evidence: This is where you bring in the charts, graphs, and key data points that prove your headline. Show the trendlines, comparison tables, or segmented data that brought you to that conclusion.
- The "Why": Insert your analytical commentary. Explain the context behind the numbers and call out any internal campaign changes or external factors that influenced the results. A deep understanding of different content performance metrics is what allows you to provide this rich context.
- The Action Plan: Always end with clear, actionable recommendations. What are the exact next steps? Who is responsible for getting them done? What outcome should we expect?
Following this structure transforms your SEM reporting from a passive, backward-looking document into an active tool that drives strategy forward. It creates a repeatable process for delivering insights that don't just get understood—they get acted on.
Reporting On Visibility In The Age Of AI Search
The search engine results page is changing more dramatically now than it has in the last decade. If your reporting doesn't adapt, you're going to get left behind. Sticking to old-school metrics like blue link rankings and click-through rates just doesn't cut it anymore. AI-driven features are completely rewiring user behavior, which means getting direct visibility inside these new elements is now a top-tier priority for any serious SEM strategy.
Think about it: features like Google’s AI Overviews deliver instant answers right on the SERP, often eliminating the need for a user to click through to a website at all. We're witnessing a fundamental shift from a "journey of clicks" to a "destination for answers," and that requires a whole new way of measuring success.
The New Currency: AI Visibility
Tracking your brand's presence within these AI-generated answers isn't just a vanity metric; it's a critical signal of your relevance and authority. When your brand is consistently cited in AI Overviews for key industry topics, it tells the world—and Google—that you're a trusted source. If you’re absent, you’re essentially invisible to a huge and growing chunk of your audience.
The data backs this up. By early 2025, Google's AI Overviews were already popping up in 30% of search results, especially for informational and problem-solving queries. This is feeding the "zero-click" search trend, where an estimated 58-60% of users get what they need from the SERP without ever visiting a website. For a B2B company, being seen in an AI response is quickly becoming as important as a traditional organic ranking.
Your brand doesn't just need to be on the first page anymore. It needs to be in the answer that the AI provides. This is the new battleground for visibility, and your reporting must reflect it.
How To Measure And Report On AI Presence
Your standard tools are probably falling short here. Most were built for a world of ranked links, not synthesized AI responses. This is where modern platforms like Attensira come in—they're specifically built to monitor your brand’s footprint within these new AI-powered SERP features.
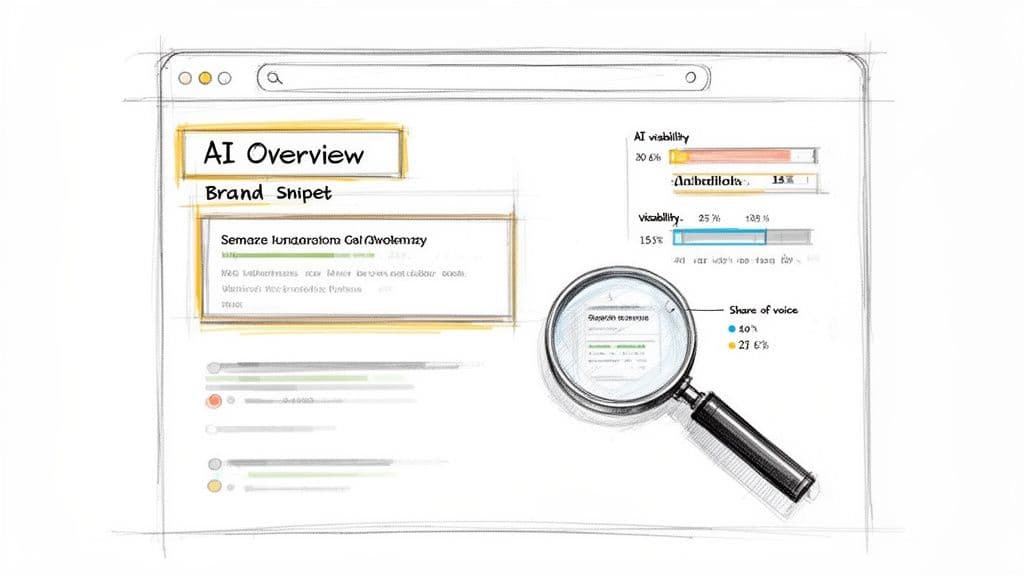
To get a real handle on this, start integrating these metrics into your reports:
- AI Visibility Score: Think of this as the new "impression share" for the AI era. It's a metric that actually quantifies how often your brand gets featured or cited in AI Overviews for the keywords you care about.
- Share of Voice in AI: This pits your AI visibility against your key competitors. It directly answers the question, "According to the AI, who owns the narrative on this topic?"
- Content Gap Analysis: A good tool can pinpoint topics where your competitors are showing up in AI answers and you aren't. This gives you a data-driven, actionable roadmap for your next content push.
To really report effectively on this, you need a solid grasp of these new SERP elements. It's worth spending some time understanding AI Overviews and their impact.
Integrating AI Visibility Into Your Dashboards
It's time to upgrade your dashboards. Right next to your trusty CPA and ROAS charts, carve out a new section for "AI-Era Visibility."
The table below breaks down how to think about this evolution from old metrics to new ones. It’s not about replacing what you already track, but about adding a crucial layer of context for the modern search landscape.
Traditional vs. AI-Driven SEM Reporting Metrics
This new layer of reporting doesn't just sit on the side; it enriches your core performance metrics. It helps paint a complete picture, showing not only how your paid campaigns are performing but also how your brand's authority is being perceived by the AI models that are shaping the future of search. Tracking this is no longer just a good idea—it's essential.
For a deeper look, check out our complete guide on how to use a https://attensira.com/blog/search-visibility-tracker.
Answering Your Toughest SEM Reporting Questions
Even with the best dashboards in place, some questions always seem to pop up. Let's tackle a few of the most common ones I hear from marketers, brand managers, and leadership, so you can sidestep these hurdles in your own reporting.
How Often Should I Actually Be Running These Reports?
This is a classic question, and the answer isn't a one-size-fits-all number. The right cadence depends entirely on who’s reading the report and what they need to do with it. I've always found a tiered approach works best.
For the folks in the trenches—the campaign managers making daily tweaks—a weekly dashboard review is non-negotiable. This is where they can spot performance shifts early, shuffle budgets around, and fine-tune ad copy or keywords before a minor issue spirals into a major problem.
But for your CMO or CEO? A weekly report is just noise. They operate on a different timeline. A monthly or quarterly report is much more their speed. This high-level summary needs to hit the big strategic KPIs: overall ROAS, customer acquisition cost, and maybe even market share growth. Your goal here is to connect SEM performance to the bigger business picture, not get bogged down in daily click fluctuations.
The real key is to match your reporting cadence to the decision-making cycle of your audience. A campaign manager makes tactical calls weekly; a CMO sets strategy quarterly. Your reports should feed directly into those cycles.
One last tip: set up automated daily alerts for the real emergencies. Think a sudden, massive spike in ad spend or your top-performing campaign getting disapproved. This lets the team react immediately without having to wait for the next scheduled report.
What Are The Most Common Mistakes I Should Avoid?
I've seen so many well-intentioned reports completely miss the mark because they fall into a few predictable traps. If you can steer clear of these, you're already ahead of the game.
The absolute biggest mistake is what I call "data dumping." This is when a report is just a massive spreadsheet of every metric imaginable, with zero context, commentary, or a clear "so what?" It’s overwhelming, and it buries the very insights you're trying to highlight. Remember, your value is in the analysis, not the raw volume of data.
Another huge one is relying on a flawed attribution model, and the most common offender is last-click attribution. This model is just plain wrong for modern marketing. It gives 100% of the credit to the final touchpoint, completely ignoring all the upper-funnel campaigns that introduced a customer to your brand in the first place. This leads to terrible budget decisions, like cutting the very ads that are filling your pipeline.
Finally, failing to connect SEM metrics to real business outcomes is a critical misstep. If you're only reporting on clicks and impressions without tying them back to qualified leads or actual revenue, you make it impossible for anyone to see the true value of your marketing dollars.
How Can I Show The Value Of SEM Beyond Just Direct Sales?
This is where great marketers separate themselves from the pack. To show the full impact of your SEM work, you have to look beyond that final click that led to a sale. So many of your campaigns, especially at the top of the funnel, are doing heavy lifting without getting the final credit.
Here’s how you can paint a much more complete picture:
- Talk About Assisted Conversions: Dive into your analytics and show how many conversions your SEM campaigns influenced, even if they didn't get the last click. This is a powerful way to show how SEM helps drive sales across all your other channels.
- Track Your Micro-Conversions: Don't just report on sales. Report on the smaller steps, like newsletter sign-ups, content downloads, or key page views. These are signals that your campaigns are building an engaged audience that will pay off down the road.
- Measure Brand Growth: For your awareness campaigns, start tracking metrics like Impression Share on important non-branded terms. You should also monitor the growth in your branded search volume over time. If that number is going up, it's a clear sign your ads are successfully building brand recognition.
How Is Reporting For B2B SEM Different From B2C?
While the foundations are similar, the reporting priorities for B2B and B2C search marketing are worlds apart, mostly because their sales cycles are so different.
B2C reporting is often about high-volume, quick-turnaround sales. The path from click to purchase can be a matter of minutes. Because of that, the KPIs that matter most are usually ROAS (Return On Ad Spend) and the total number of transactions. It’s pretty straightforward.
B2B, on the other hand, is a completely different beast. The sales journey is long and complex, often involving multiple decision-makers. The focus here shifts from instant sales to lead generation and nurturing. The metrics you'll obsess over are Cost Per Lead (CPL), Cost Per Qualified Lead (CPQL), and your lead-to-customer conversion rate. And critically, B2B reporting is useless without deep integration with a CRM. You have to be able to track a lead from that initial ad click all the way to a signed deal that might happen months later.
Ready to stop guessing and start measuring your brand's visibility in the new era of AI search? Attensira provides the critical insights you need to see where you stand, identify content gaps, and ensure your brand is part of the AI-generated conversation. See how you stack up against the competition.