What is an SEO report? Learn how this critical tool translates complex data into a clear roadmap for B2B growth by tracking the metrics that actually matter.
At its core, an SEO report is a snapshot of how your website is performing in search engines. Think of it less like a dry spreadsheet and more like a regular health check-up for your brand's online presence. It takes all the complicated data from your SEO efforts and turns it into a clear, understandable story about what's working, what's falling flat, and where you need to go next.
The whole point is to connect your SEO work to real business results.
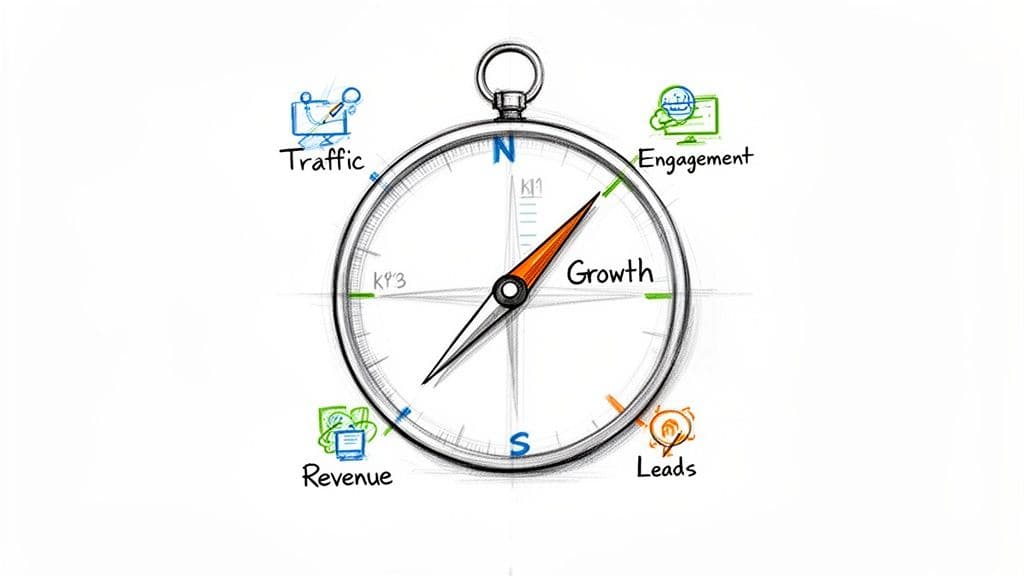
Why an SEO Report Is Your Business Growth Compass
An SEO report isn't just a backward-glance at vanity metrics. It's the compass that points your entire digital strategy forward. It translates raw performance data into a narrative of wins, challenges, and—most importantly—untapped opportunities. When you see it as a diagnostic tool, you start to understand your website’s health, where you stand against competitors, and how people actually find and interact with your brand online.
This reframes the entire conversation. Instead of getting bogged down in abstract numbers, you start talking about tangible business outcomes. A great report doesn't just list keyword rankings; it shows how those rankings are bringing in qualified leads. It doesn't just show traffic spikes; it demonstrates how that traffic is feeding the sales pipeline.
When you can see the direct line between SEO activities and business growth, it’s much easier for everyone—from the marketing team to the C-suite—to grasp the value.
Connecting Data to Dollars
The real muscle of an SEO report is its ability to justify your budget and sharpen your strategy for the months ahead. The practice of SEO reporting really took off around 2010 when tools like Google Analytics became commonplace. For the first time, marketers could reliably track organic search traffic, which was already driving a huge chunk of website visits. That data quickly became mission-critical for any brand serious about online visibility.
A well-crafted report gives you the power to:
- Spot Your MVP Content: Immediately see which articles, landing pages, or product pages are pulling in the most valuable organic traffic.
- Get Inside Your Audience's Head: Understand the exact search terms people use to find you and map out the journey they take once they land on your site.
- Justify Marketing Spend: Draw a straight line from your SEO activities to leads, sales, and revenue, proving a clear return on investment.
Ultimately, an SEO report should clearly demonstrate value and contribute to the overall business strategy, aligning with principles on how to measure marketing ROI for real business growth.
By connecting these dots, your report evolves from a simple performance summary into an indispensable tool for making smart business decisions. If you want to dig deeper into the financial side of things, check out our guide on https://attensira.com/blog/how-to-measure-marketing-roi.
To start, let's break down the foundational pieces every modern SEO report should have.
Core Components of a Modern SEO Report
This table gives a quick overview of the essential pillars in every SEO report and the primary business question each one answers.
Think of these components as the chapters in your SEO story. Each one builds on the last, giving you a complete picture of your performance and a clear path forward.
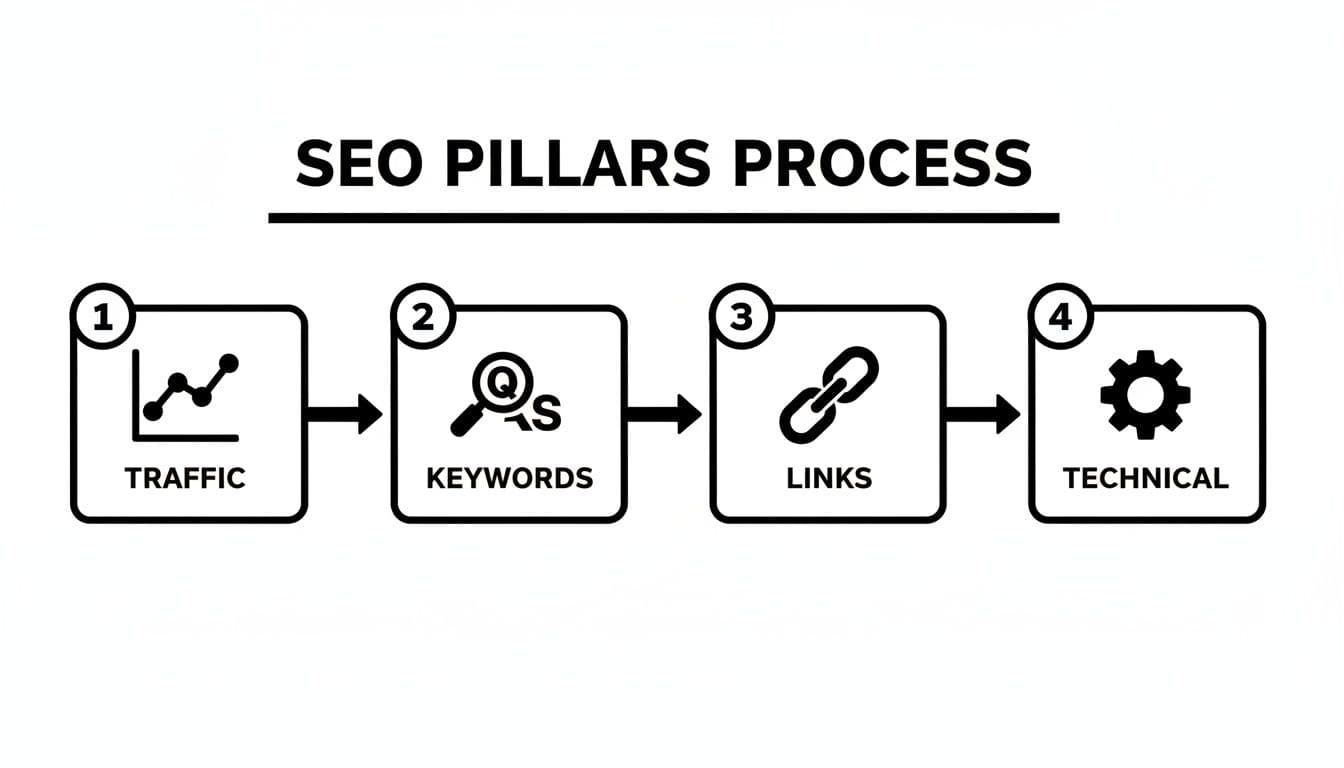
The Four Pillars of a High-Impact SEO Report
A great SEO report does more than just dump data on your desk. It tells a story, and that story is built on four distinct but deeply connected pillars. Think of them as the support columns holding up your entire SEO strategy. When you look at each one, you stop being a data collector and start becoming an interpreter, piecing together the complete narrative of your website’s performance.
Each pillar answers a fundamental question about your online presence, making sure your analysis is thorough and, most importantly, tied directly to what the business actually cares about.
Let's break down what each of these core components really tells you.
Pillar 1: Organic Performance
This is the bottom line—the most direct measure of whether your SEO is actually working. Organic performance tracks the volume and, crucially, the quality of visitors who land on your site from search engines without you paying for an ad. It’s the ultimate report card on whether your content is hitting the mark with your target audience.
Inside this pillar, you’ll dig into a few key metrics:
- Organic Traffic: The raw number of sessions coming from organic search. A steady upward trend here is the clearest sign of growth.
- User Engagement: Metrics like bounce rate, time on page, and pages per session show what people do once they arrive. A low bounce rate on a critical service page, for instance, is a fantastic indicator that you're attracting the right kind of traffic.
- Top Landing Pages: This identifies which pages are your front doors from search, showing you which content assets are pulling the most weight.
The data on this is crystal clear. Companies that report on this regularly see 214% more organic traffic over two years compared to those that don't. With organic traffic growing by 12% YoY in major markets and accounting for almost half of all website visits, flying blind on performance means leaving a massive amount of growth on the table.
Pillar 2: Keyword Visibility
So, traffic tells you how many people are showing up. Keyword visibility tells you how they're finding you in the first place. This pillar is all about your website's rankings for the specific search terms that matter to your business—from the "just browsing" informational queries to the "ready to buy" commercial ones.
This analysis is vital because it’s a direct measure of your market share in the search results. Are you showing up when potential customers are just starting their research? What about when they’ve got their credit card out? Tracking your position for these terms gives you a real-time view of your competitive standing and pinpoints exactly where the opportunities are to grab more qualified traffic.
Pillar 3: Backlink Profile Health
Think of your backlink profile as your website’s professional network. Every link from a reputable site is like a vote of confidence, a strong reference telling search engines that you’re a credible, authoritative source of information. It’s digital word-of-mouth.
A healthy backlink profile isn't just about collecting as many links as possible. It's about quality and relevance. A single link from a top-tier industry publication can easily be worth more than a hundred links from spammy, low-quality directories.
This pillar is where you analyze:
- Total Referring Domains: The number of unique websites linking back to you.
- Link Quality: The authority and trustworthiness of those domains.
- Anchor Text Distribution: The actual clickable text used in those links, which gives search engines powerful context about your page’s topic.
A strong backlink profile is one of the most powerful assets you can build, directly fueling your site’s ability to rank for the keywords that drive revenue.
Pillar 4: Technical SEO Audits
This last pillar is the foundation everything else rests on. Technical SEO is about making sure your website is easy for search engine crawlers to access and understand, and just as importantly, that it gives human users a great experience. If your site is a technical mess, even the most brilliant content and stellar backlinks won't get you very far.
This part of the report shines a light on critical health factors, such as:
- Site Speed: How fast your pages load. This is a huge factor for both user experience and rankings.
- Mobile Usability: How well your site works on a phone or tablet.
- Crawlability and Indexability: Any errors that are blocking search engines from finding and indexing your content.
Monitoring these elements is like doing preventative maintenance on a high-performance engine. By catching and fixing technical glitches early, you give all your other SEO efforts the solid ground they need to succeed. To get a much deeper look into this process, check out our guide on how to perform an SEO audit.
How to Translate SEO Data into Actionable Strategy
An SEO report is just a collection of charts and numbers until you turn it into a plan. The real magic isn't in the data itself—it’s in the story it tells and the actions it sparks. This is the crucial step where you stop just looking at metrics and start interpreting patterns, asking the right questions, and building a roadmap for growth.
Think of yourself as a detective. Every metric is a clue. A sudden drop in organic traffic isn’t just a bad number; it's a lead you need to follow. Was there a Google algorithm update last week? Did a competitor just drop a massive guide on a topic you own? Or is it a predictable seasonal dip? Without that context, you’re just chasing ghosts.
Connecting the Dots from Data to Decisions
The key is to never look at a single metric in a vacuum. A great analyst knows how to connect different data points to diagnose the root cause of a problem or an opportunity.
Let’s take a classic example. You see a key landing page is getting tons of impressions in Google Search Console but has a painfully low click-through rate (CTR).
- The Data: You’re visible (high impressions), but nobody is clicking (low CTR).
- The Interpretation: The page is showing up in search results, which is great, but your title tag and meta description are failing to grab anyone's attention. They just aren't compelling enough to earn the click.
- The Action: Time to A/B test some new headlines and meta descriptions. Focus on benefits, ask a question, or create a sense of urgency to see if you can improve that CTR.
This simple process—moving from observation to action—is what separates a successful SEO program from one that just spins its wheels. If you want to get a better handle on which numbers truly matter, our guide on understanding content performance metrics is a great place to start.
This diagnostic approach works because every part of SEO is connected. You can't just focus on one area and expect everything else to fall into place.
As you can see, a healthy strategy is a balancing act. You need to drive traffic, target the right keywords, build link authority, and maintain a solid technical foundation. They all work together.
A Framework for Strategic Analysis
To make this repeatable, you need a framework that forces you to think critically. Instead of just noting that something changed, you have to ask why it happened and what you can do about it. This is how a passive report becomes an active strategic tool.
Here’s a simple four-step framework I use:
- Identify Anomalies: Scan your report for anything that jumps out—big spikes, sudden drops, or long flatlines in your KPIs. Did organic traffic to your blog suddenly pop by 30%? Or did rankings for a high-value keyword cluster just fall off a cliff?
- Formulate a Hypothesis: Make an educated guess about the cause. For example, "That traffic spike probably happened because our new article hit page one for a high-volume keyword."
- Investigate and Validate: Now, go prove it. Dive into your tools to confirm or deny the hypothesis. Check Google Search Console to see which queries are driving the new traffic. Look at your backlink profile in a tool like Ahrefs or Semrush—did you just land a killer link?
- Define the Action Plan: With your findings confirmed, outline clear next steps. "Since that long-form guide format performed so well, we're going to create a series of related articles to build a topic cluster and really own this space."
The goal is to transform every piece of data into a decision. A report that ends with a list of numbers is incomplete. A report that ends with a prioritized to-do list is a powerful tool for growth.
To help you get started, here’s a quick diagnostic table that maps common problems you might see in a report to their likely causes and what you should do next.
From SEO Problem to Strategic Solution
This table is just a starting point, but it shows the kind of thinking you need to apply. By adopting this mindset, every SEO report becomes a launchpad for your next strategic move, ensuring your efforts are always guided by solid data.
Crafting an SEO Report That C-Suite Executives Will Actually Read
Let's be honest: the most detailed, technically perfect SEO report is worthless if it never gets read by the people who approve budgets and make strategic decisions. C-suite executives live in a world of bottom lines, not keyword fluctuations. They need the big picture, and they need it fast.
So, how do you get their attention? You stop data-dumping and start storytelling. Your job is to translate SEO metrics into a compelling narrative about business growth, competitive threats, and untapped opportunities. Every number you present must answer their unspoken question: "How does this affect our revenue, market share, and bottom line?"
The Five-Part Narrative Template
To get executive buy-in, you need to frame your report like a business case, not a technical audit. This five-part structure is designed to do just that, moving from a high-level summary to a forward-looking strategy. It's built to respect their time by putting the conclusions first.
- Executive Summary: The entire report, distilled into three powerful bullet points. This is your hook.
- Performance Dashboard: A clean, visual snapshot of how SEO is impacting core business goals.
- Competitor Benchmark: Crucial context showing where we stand against the competition.
- Opportunities and Risks: A clear-eyed look at potential wins and threats on the horizon.
- Strategic Recommendations: An actionable roadmap for what to do next and why it matters.
This approach gives them the "so what?" upfront, with the supporting data available for those who want to dig a little deeper.
Building Each Section for Executive Impact
The secret is to relentlessly connect every data point to a tangible business outcome. Ambiguous metrics get glossed over, but numbers tied directly to the sales pipeline get serious attention.
1. The Executive Summary This is it—the most critical part of your entire report. Assume it might be the only section they read. It needs to be sharp, concise, and packed with impact.
- Top-Line KPI Snapshot: Lead with the money. For example: "This quarter, organic search drove $2.5M in attributable pipeline revenue, a 15% jump year-over-year."
- Key Win: Spotlight a single, major success story. "Our new content hub secured the #1 ranking for '[High-Value Keyword]', generating over 500 marketing-qualified leads."
- Primary Focus for Next Quarter: State your next big objective. "For Q2, our primary focus is on dominating the [New Product Category] vertical by targeting three strategic keyword clusters."
2. Performance Dashboard Visuals are your best friend here. Think simple, clean charts that tell a story at a glance. Avoid cramming too much data into one graph—clarity is king.
A great dashboard should answer one question instantly: "Are we winning?" A simple line chart showing an upward trend in organic-driven conversions is infinitely more powerful than a spreadsheet of 50 keyword ranking changes.
Focus on the metrics that speak their language. Instead of just "Organic Traffic," reframe it as "Organic Lead Conversion Rate." This instantly connects your work to business results. For a deeper dive, our guide to digital marketing performance metrics provides an excellent framework for choosing the right KPIs.
3. Competitor Benchmark Executives are hardwired to be competitive. This is where you give them the lay of the land, showing exactly where the company stacks up.
- Share of Voice: "Our share of voice for our top 10 commercial keywords has grown from 18% to 22%, while Competitor X has slipped to 15%."
- Backlink Gap Analysis: "We're closing the authority gap with Competitor Y, having earned 15 high-authority links from major industry publications where they have no presence."
4. Opportunities and Risks Summary Now, you translate your analysis into strategic talking points. This is where you show them the next hill to take and what dangers lie in wait.
- Opportunity Example: "Our research identified a major content gap for '[Emerging Industry Topic]'. Building a dedicated resource hub could capture an estimated 10,000 monthly searches and cement our position as the go-to expert."
- Risk Example: "Competitor Z just launched a new tool that's quickly earning backlinks and ranking for our core terms. We risk losing significant market share if we don't counter with a competitive content and PR push this quarter."
5. Recommendations and Roadmap Finally, you present a clear, prioritized action plan. This isn't a laundry list of technical SEO chores; it's a strategic roadmap where every action is tied to a business impact.
For example, instead of a dry recommendation like "Fix 404 errors," you frame it strategically: "We need to reclaim lost link equity by redirecting broken pages. This is projected to boost our overall domain authority and lift rankings for key service pages, directly impacting lead flow." This kind of framing turns a simple report into an indispensable tool for strategic decision-making.
The Future of Reporting in the Age of AI Search
The ground is shifting under the world of search. For years, we’ve built SEO reports around a reliable set of metrics—keyword rankings, organic traffic, and other KPIs all tied to the classic Google search results page. But with AI-driven engines like Perplexity and Google’s own AI Overviews becoming more common, a whole new layer of discovery is emerging. In this new world, old-school metrics are quickly starting to feel obsolete.
This isn't just a minor update; it's a completely new game. When a user gets a direct answer from an AI instead of clicking through a list of blue links, how do you measure visibility? Your position on the page suddenly matters a lot less. The real goal is no longer just ranking on a SERP—it's about becoming the trusted source that an AI relies on to formulate its answers.
Moving Beyond Rankings to AI Visibility
As AI increasingly becomes the go-to interface for finding information, our SEO reports have to evolve. We need to start tracking our presence within these new conversational platforms. That means adopting a fresh set of KPIs built to measure influence and visibility where it now counts: inside AI-generated responses. Simply put, you need to know if you're part of the AI's conversation.
These are the next-generation metrics that need to be in your report:
- Share of Voice in AI Answers: Think of this as the new "ranking." It tracks how often your brand or content is cited as a source in AI responses for your core topics.
- Brand Mentions in AI Conversations: This goes a step further, tracking every time your brand name shows up in an AI answer, even without a direct link. It’s a powerful signal of your topical authority.
- Sentiment Analysis of Mentions: When your brand does get mentioned, is it in a good light? Understanding whether the context is positive, negative, or neutral is essential for managing your reputation in this new channel.
This shift is especially critical for B2B companies, where buyers use AI for initial research and vendor vetting. If you're not showing up in those AI-generated answers, you're invisible. Our guide on AI search optimization digs much deeper into the specific strategies needed to secure this new kind of visibility.
This isn't the first time we've seen such a dramatic change. SEO reports transformed from simple traffic logs in the early 2000s to the complex dashboards we use today, largely thanks to Google's 2012 Penguin update. That algorithm change forced us to add backlink quality analysis to our reports—a metric now so standard we know that domains with 50+ high-DA backlinks tend to achieve 3.8x higher rankings.
The New KPIs for an AI-First World
To give a true picture of performance today, your SEO report needs to capture your entire digital footprint, well beyond the traditional SERP. The landscape of AI is broad, and even specialized AI-powered tools like SupportGPT offer clues into how technology is reshaping data analysis and reporting.
The ultimate goal is to understand your brand's "AI-readiness." A modern SEO report must answer not just "How do we rank on Google?" but "How influential are we in AI-driven conversations?"
Here’s a look at what a modern, AI-focused dashboard might include.
This kind of dashboard prioritizes brand presence within AI ecosystems, treating mentions and sentiment as core indicators of success.
To build this view, your report must pull in data that tracks your brand’s authority signals across the entire web. You need to monitor how your content is being referenced, cited, and discussed—not just by other websites, but by the AI models themselves. By tracking these new signals, your SEO report stops being a look back at old rankings and becomes a forward-looking tool for measuring real influence.
Common Reporting Mistakes and How to Avoid Them
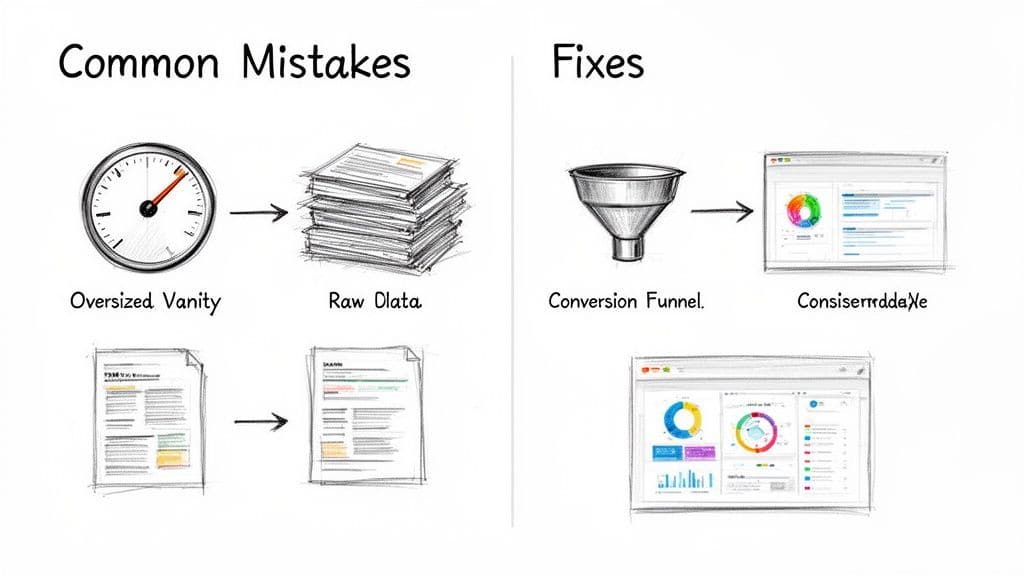
Even the most meticulously compiled SEO report can fall flat. It's a common story: a report loaded with data gets delivered, only to be met with confusion or, worse, silence. When this happens, it's usually because the report has fallen into a few predictable traps that turn a powerful strategic tool into a wasted opportunity.
The most common culprit? A fixation on vanity metrics. It’s easy to get excited about a jump in organic traffic or seeing a few more keywords crack the top ten. But what do those numbers really mean? If that traffic isn't converting and those keywords are only attracting window shoppers, those feel-good metrics are just noise.
The real goal is to connect SEO activity to what the business actually cares about. Shift the focus to things like goal completions, lead quality, and the holy grail: revenue that can be directly attributed to your organic search efforts.
From Data Dumps to Actionable Insights
Another classic mistake is the dreaded data dump. This is when you send over a spreadsheet crammed with charts and figures but offer zero interpretation. It's the difference between telling someone traffic to a key page dropped 30% and explaining why it dropped—and what you're going to do about it.
An insight is the conclusion you draw after connecting different data points. Simply reporting a number isn't an insight; explaining that the number fell because a competitor published a better article is.
To make your reports truly valuable, pair every significant data point with a simple "So What?" analysis. This is where you connect the dots for your audience and lay out the recommended next steps. It's about providing answers, not just more data.
Finally, never assume a one-size-fits-all report will work. It won’t. Your CEO and your content team operate in different worlds, and they need different information to make decisions. Sending the same granular report to both is a recipe for getting ignored.
You have to tailor the report to the person reading it.
- For Executives: Think high-level. A concise, one-page dashboard is perfect. Focus on the big-picture KPIs they care about—revenue from organic, market share growth, and how you stack up against the competition.
- For Marketing Teams: This is where you can get into the weeds. Give them the detailed breakdown of keyword movements, top-performing content, backlink progress, and technical site health. This is the information they need to guide their daily work.
By sidestepping these common blunders, your SEO report becomes more than just a look in the rearview mirror. It transforms into a strategic document that proves the value of your work and actively shapes what comes next.
Diving Deeper: Your SEO Reporting Questions Answered
Let's clear up a few of the most common questions that pop up when teams start getting serious about SEO reporting.
How Often Should I Run an SEO Report?
There’s no single right answer here—it really hinges on what you’re trying to accomplish.
For most teams in the thick of executing a strategy, monthly reports are the sweet spot. This cadence is frequent enough to catch trends and make timely adjustments, but it gives you enough data to avoid knee-jerk reactions to the normal, day-to-day blips in performance.
For the C-suite or for high-level strategic reviews, quarterly reports are usually a better fit. They zoom out to show the bigger picture, connecting your SEO efforts to long-term business growth and proving ROI. It's also smart to pull a one-off report anytime you roll out a major site update, launch a big campaign, or see a significant Google algorithm update hit the news.
What’s the Difference Between an SEO Report and an SEO Audit?
This is a great question, and it's easy to get them mixed up. Think of it like this: an SEO report is like your regular doctor's check-up, while an SEO audit is a full-body MRI.
Your SEO report is the recurring check-in. It tracks your vitals (KPIs) over time, showing you how the treatment plan (your SEO strategy) is working. It’s all about monitoring progress and momentum.
An SEO audit, on the other hand, is a deep-dive, one-time diagnostic. Its job is to uncover every single underlying issue—from technical glitches and content gaps to missed strategic opportunities. The audit gives you the initial roadmap; the reports show you how well you're navigating it.
Can I Create a Decent SEO Report Using Only Free Tools?
You absolutely can. In fact, you can build a surprisingly robust and insightful report using tools that won't cost you a dime.
- Google Analytics is non-negotiable. It's your source of truth for organic traffic, user behavior, conversions, and how people are actually interacting with your site once they arrive.
- Google Search Console is your direct line to Google. It tells you exactly how the search engine sees your site, providing priceless data on keyword performance, impressions, clicks, and any technical red flags.
Sure, paid tools can give you more granular competitive data or deeper backlink analysis. But with just these two free powerhouses, you have more than enough information to create a report that drives real, meaningful strategic decisions.
Ready to see how your brand shows up in the new world of AI search? Attensira provides the visibility and insights you need to optimize your content for AI-driven engines. Stop guessing and start measuring your AI presence today. Get started with Attensira.