Go beyond vanity stats. This guide covers the content performance metrics that truly matter for proving ROI, driving growth, and making smarter decisions.
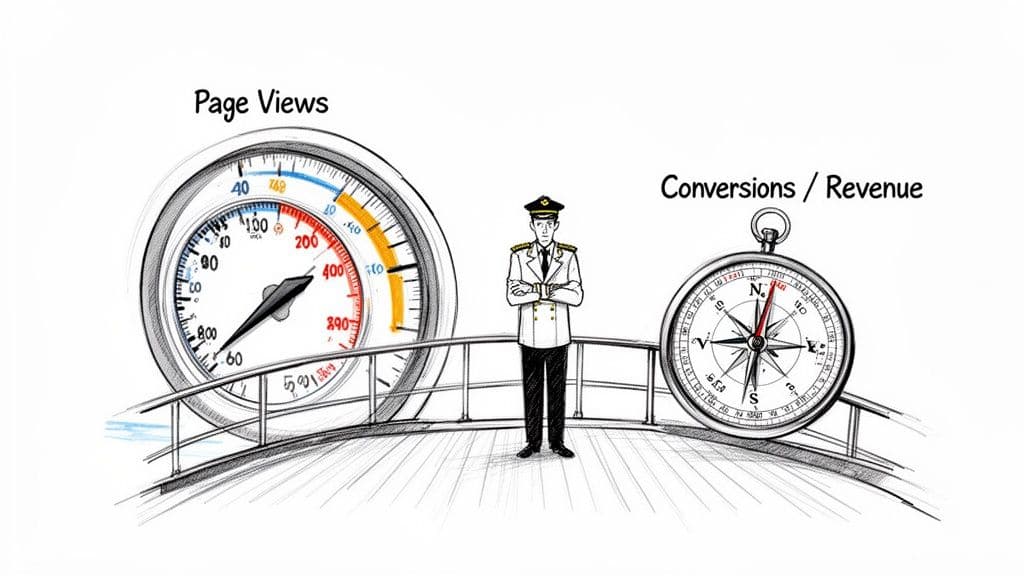
Content performance metrics are the numbers that tell you if your content is actually working. Think of them as the navigational instruments on a ship; they show you whether your content strategy is on course or just drifting. Without them, you’re essentially creating content with your eyes closed, hoping you end up somewhere valuable.
Moving Beyond Vanity Metrics
In the competitive B2B world, creating content without a clear measurement plan is a huge mistake. It's like a ship captain who's obsessed with the ship's speed but completely ignores the compass. Sure, page views and social media likes—what we often call vanity metrics—can feel good. They give you a sense of motion. But they don't tell you if you're actually heading toward your real destination: business growth.
Making this shift from vanity to value is what separates a successful content program from a very expensive hobby. The data backs this up. A recent study found that 84% of top-performing B2B organizations measure content performance effectively, while only 15% of the least successful teams do the same.
Even so, the struggle is real. 56% of marketers say that tying their efforts to ROI remains a huge challenge, which just goes to show how hard it can be to connect a blog post to a closed deal. You can dig into more of these findings in the Content Marketing Institute's B2B benchmarks.
The Problem with Surface-Level Data
Let's be honest: focusing only on a big number like "traffic" can be dangerously misleading. A blog post might pull in 100,000 views, which sounds amazing. But what if none of those visitors convert, sign up for your newsletter, or even read past the first paragraph? Did that content actually perform? Not really.
This is the central flaw of vanity metrics. They lack the context you need to make smart business decisions. To truly understand performance, you have to dig deeper into what users are doing and how that behavior impacts your bottom line.
A high page view count with a low conversion rate is just a missed opportunity. It proves you can attract an audience, but it also reveals you're not giving them a compelling reason to stay or act.
To get past this, we need a better framework. A truly effective measurement strategy organizes data around core business objectives, not just isolated numbers. This is where the four pillars of content performance come into play.
The Four Pillars of Content Performance Measurement
To build a measurement framework that actually tells a story, we can group our metrics into four distinct categories. Each pillar answers a fundamental question about your content's journey, from getting discovered in the first place all the way to generating revenue. This structured approach helps you translate raw data into a clear narrative about how your content is contributing to the business.
By looking at your content through these four lenses, you get a complete picture. You’re no longer just collecting data points; you're understanding the entire lifecycle of your content's impact.
Tracking Content Visibility in the AI Era
Before your content can make an impact, people have to find it first. Visibility metrics are the absolute bedrock of content performance, telling you how easily your audience can discover what you've created. For years, this was all about traditional search engine optimization (SEO), but the rules of the game are changing—fast.

Think of classic SEO as setting up a shop on a busy main street. Metrics like organic traffic, keyword rankings, and impressions tell you how many people are walking past your storefront and glancing in the window. They're still incredibly important; after all, as of 2025, an estimated 68% of online experiences still kick off with a search engine.
But there’s a new force at play. Google’s AI Overviews are now popping up for nearly 10% of all keywords, and their footprint has grown a staggering 116% year-over-year. The data shows a clear trend: since these AI answers launched, total search impressions are up 49%, but the average click-through rate has dropped by almost 30%, according to the latest research on AI's impact on content marketing. This isn't just a minor tweak; it's a fundamental shift that requires a new way of thinking about visibility.
Understanding Traditional Visibility Metrics
Even as the ground shifts, you can't build a new strategy without a solid foundation. These classic content performance metrics give you a baseline for your reach and are the essential building blocks for any deeper analysis.
- Organic Traffic: This is the raw number of people who land on your site from an unpaid search result. It’s the clearest signal that your content is successfully pulling in an audience from places like Google.
- Keyword Rankings: This simply tracks where your content shows up on the search results page for a specific query. The higher you rank, the more likely you are to get that organic traffic.
- Impressions: An impression is counted every single time your content is shown in the search results. This number tells you how often your content is put in front of potential visitors, whether they click on it or not.
These metrics don't exist in a vacuum; they tell a story together. For instance, seeing tons of impressions but very little traffic could mean your headlines and meta descriptions aren’t compelling enough to earn the click. It tells you that your "storefront" is in a great location, but something about the window display is making people walk on by.
The New Frontier: AI Visibility
AI-powered search is turning the old storefront model on its head. It’s no longer just about being on the main street. Now, it’s about becoming the trusted expert recommended by the super-helpful assistant inside the store. This means we have to start tracking a whole new class of metrics.
In the AI era, visibility is less about getting a click and more about becoming the source of truth. The goal is to have your brand and insights cited directly within AI-generated answers, building authority at the point of inquiry.
This new reality brings metrics to the forefront that didn't even exist a few years ago.
- Share of AI Voice: This measures how often your brand is mentioned or cited in AI answers (from ChatGPT to Google's AI Overviews) for your key topics, especially when compared to your competitors.
- Brand Citations in AI Overviews: A direct count of how many times your website is named as a source within Google’s AI-generated summaries at the very top of the search results.
- Presence in Generative Responses: This tracks if your content is being pulled into answers on major platforms like Perplexity, ChatGPT, and Gemini.
Keeping an eye on these AI-centric metrics is no longer a "nice-to-have." A high Share of AI Voice can build incredible brand authority and trust, even when it doesn't lead to a direct click. To do this right, you need a systematic way to monitor it. If you’re ready to get started, our guide on how to track your brand’s visibility in ChatGPT and other top LLMs breaks it down.
Platforms like Attensira are designed to bring clarity to this new landscape, showing you exactly where your content is showing up in AI responses. With this kind of data, you can start optimizing your content not just for old-school search algorithms, but for the language models that are quickly becoming the new gatekeepers of information. A complete view of your content's reach now demands a dual focus—on both traditional SEO and this emerging world of AI-driven visibility.
Measuring Audience Engagement and Resonance
So, your content is getting seen. That’s a great start, but visibility metrics only tell you that people showed up to the party. Engagement metrics tell you if they actually stuck around, had a good time, and want to come back. Getting thousands of views is just a vanity number if visitors bounce away in a few seconds.
The real measure of performance is how deeply your audience connects with what you've created. This is all about engagement and resonance.
Think of it like a real conversation. A high bounce rate is like someone turning their back on you the moment you say "hello." But a long time-on-page and deep scroll depth? That’s them leaning in, fully absorbed, waiting to hear what you'll say next. These are the signals that tell you your message is truly landing.
Key Metrics for Gauging Audience Interest
To figure out if you're making a real connection, we have to look past simple views and dig into behavioral data. These content performance metrics give you a direct window into how people interact with your pages after they arrive. They paint a much clearer picture of what’s catching their attention and what’s making their eyes glaze over.
Here are the essential engagement metrics to keep an eye on:
- Average Engagement Time: This isn't just about how long a tab is open; it measures the average time your webpage was the main focus in a user's browser. A longer time suggests your content is genuinely compelling. A short time might mean your headline wrote a check the content couldn't cash.
- Bounce Rate: This is the percentage of people who land on a page and leave without doing anything else—no clicks, no scrolling, nothing. A high bounce rate is often a glaring sign that the page didn't deliver what the visitor expected or failed to answer their question.
- Scroll Depth: This tells you how far down the page people are actually getting. Discovering that 75% of your visitors are making it past the halfway mark is a fantastic sign that your content flows well and keeps them hooked from one section to the next.
These metrics don’t live in a vacuum; they tell a story when you look at them together. For instance, a page might get a ton of traffic but have a sky-high bounce rate and a pitifully low engagement time. That’s a classic red flag. You’re great at getting people in the door, but the content itself is failing to connect, which means it's time for a rewrite.
From Interest to Action: Content-Driven Conversions
At the end of the day, real engagement should inspire someone to do something. These "micro-conversions" might not be a direct sale, but they are crucial signs that your content has built enough trust and delivered enough value for a person to take the next step.
True resonance isn't just about holding attention; it's about inspiring action. When a reader downloads a guide or subscribes to your newsletter, they are explicitly telling you that your content is valuable enough to trade their personal information for.
These actions are the tangible proof that your content is working and are absolutely critical for moving people from casual readers to committed leads.
- Newsletter Sign-Ups: When someone subscribes, they're raising their hand and saying, "I want to hear more from you." This turns a passive reader into a dedicated audience member.
- Asset Downloads: Someone downloading an ebook, whitepaper, or case study shows a serious interest in the subject. It also positions your brand as a credible, go-to source.
- Demo Requests or Contact Form Submissions: These are the big ones. They are high-intent actions that create a direct line from your content to your sales team, proving a clear business impact.
By tracking these conversions, you can pinpoint exactly which topics, formats, and writing styles don't just entertain your audience but actually motivate them. This shifts your strategy from guesswork to a repeatable system for building relationships and driving real business results.
Connecting Content to Conversions and Revenue
Getting eyes on your content is a great start, and seeing people engage with it is even better. But let’s be honest—the metrics that really move the needle in the boardroom are the ones tied directly to the bottom line. This is where you prove your content strategy isn't just a marketing expense but a powerful engine for growth.
The whole point is to draw a straight line from a blog post, a webinar, or a case study to a tangible business result, like a new sales lead or a signed contract. To do that, we need to shift our focus down the funnel, where every action has a clear dollar value. These are the numbers that justify your budget and prove your worth.
From Engagement to Leads
The first real step in connecting content to cash is tracking how well it generates qualified leads. A lead isn't just some anonymous visitor; it's a person who has shown genuine interest by giving you their contact information. They've raised their hand, signaling they might be ready to talk business.
Here are the key metrics to watch:
- Lead Generation Rate: What percentage of people who consume your content actually fill out a form? This is a direct measure of how compelling your call to action is.
- Marketing Qualified Leads (MQLs): This metric is smarter. It filters for leads who match your ideal customer profile. A high MQL count from a specific article tells you it’s attracting the right audience, not just any audience.
- Cost Per Lead (CPL): How much are you spending to get one lead through your content efforts? A low CPL means your content engine is running efficiently.
These metrics turn your content from a simple library of information into a predictable machine for generating leads. They're also the first data points you need to start calculating your marketing ROI—a critical skill for any serious marketer. For a much deeper look at this, check out our complete guide on how to measure marketing ROI.
The Art of Content Attribution
Okay, so you’re generating leads. Now for the tricky part: which piece of content gets the credit? A buyer's journey is almost never a straight line. Someone might find your blog through a Google search, see a social media post a week later, and finally convert after clicking a link in your newsletter. Who's the hero here?
Think of it like a soccer team. Does only the striker who scored the goal get the credit? What about the midfielder who made the perfect pass or the defender who started the whole play from the back?
Attribution isn't about finding a single "hero" piece of content. It’s about understanding how your entire content ecosystem works together to guide a customer from that first flicker of awareness to the final purchase.
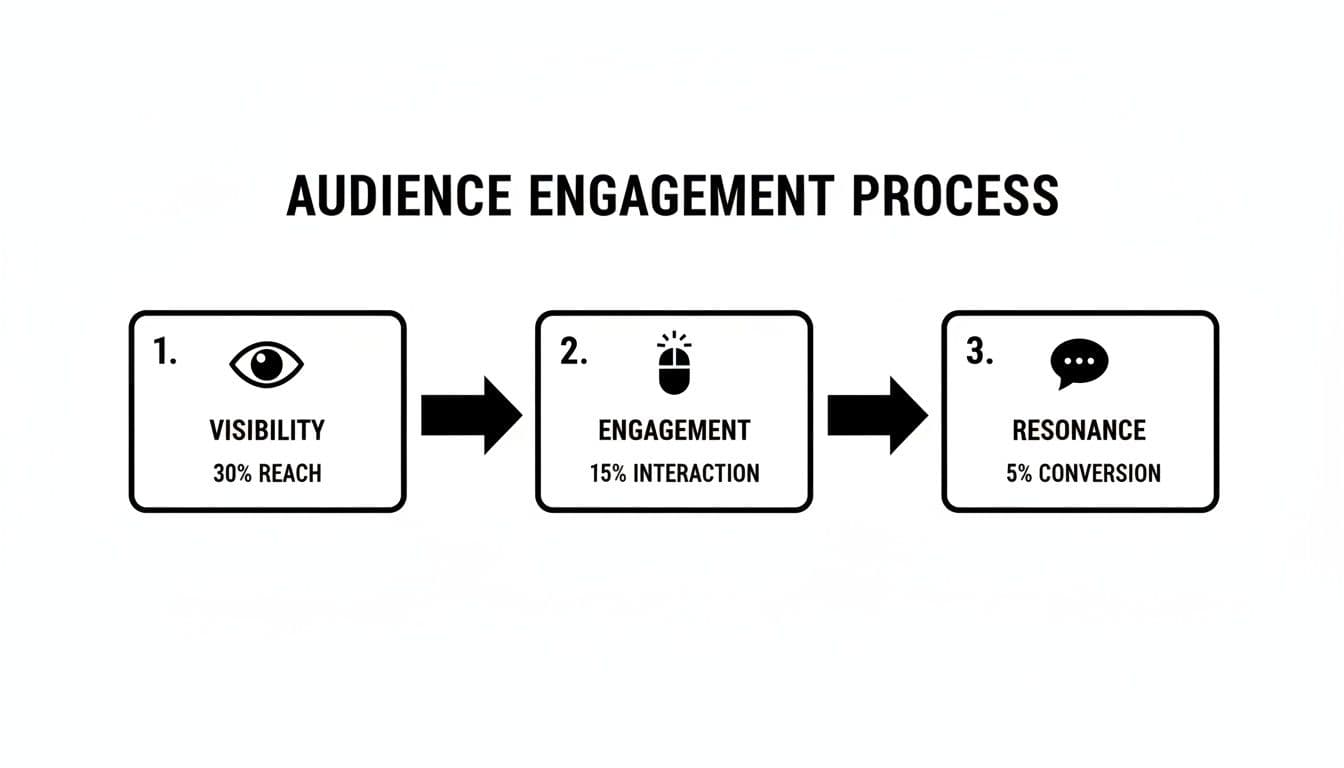
This journey is a funnel. You start with broad visibility, filter down to an engaged group, and end with a core audience that truly resonates with your message and is ready to act.
This is where different attribution models come into play:
- First-Touch Attribution: This gives 100% of the credit to the very first piece of content a customer ever saw. It’s perfect for identifying what content is best at bringing new people into your world.
- Last-Touch Attribution: All the credit goes to the final touchpoint before the conversion. This model is great for pinpointing which content is most effective at sealing the deal.
- Multi-Touch Attribution: This is easily the most sophisticated and realistic approach. It distributes credit across multiple touchpoints, acknowledging that each piece of content played a role in the journey.
To get a true picture of how all your content works as a team to drive business, you really need to be using multi-touch attribution models. They provide a much more complete and honest view of your marketing impact.
The Ultimate Metric: Content-Influenced Revenue
At the end of the day, it all comes down to one number: content-influenced revenue. This is the total revenue from all closed deals where content played a part—at any point in the customer's journey. It's the definitive answer to the question, "Is our content marketing actually making us money?"
Tracking this properly requires a solid connection between your CRM and your analytics platform. But when you can confidently walk into a meeting and show that your content efforts influenced $500,000 in new business last quarter, you're no longer talking about vanity metrics. You're talking about real, undeniable business impact.
This is the shift in thinking that separates good content marketers from great ones. The conversation moves from "How many people read our blog?" to "How much business did our content generate?" For any modern B2B company, that’s the only conversation that truly matters.
Building Your Content Performance Dashboard
Tracking individual metrics is one thing, but making sense of them is another. The real magic happens when you bring all those numbers together into a single, cohesive dashboard. Think of it as the command center for your entire content operation—it’s where a jumble of raw data becomes a clear, actionable story about what’s working and what isn’t.
A well-designed dashboard does more than just report on past performance; it helps you make smarter decisions for the future. By centralizing your insights, you can spot trends, double down on high-performing content, and catch problems before they grow. This is the difference between simply reacting to numbers and building a truly proactive, data-informed strategy.
Choosing Your Essential Tools
To build your command center, you'll need the right set of tools. No single platform can give you the complete picture, which is why most marketers rely on a combination—often called a "stack." The goal is to select tools that cover all the critical stages of the customer journey without creating data silos or unnecessary complexity.
Essential Tools for Your Content Metrics Stack
A solid tech stack doesn't need to be overly complicated. It just needs to cover your bases, from initial visibility all the way to revenue. Here’s a breakdown of the key categories and some of the go-to tools for the job.
By integrating these tools, you move from isolated data points to a complete, 360-degree view of your content's impact. For a deeper look at how these fit into a wider strategy, check out our guide to digital marketing performance metrics.
Structuring Your Dashboard for Clarity
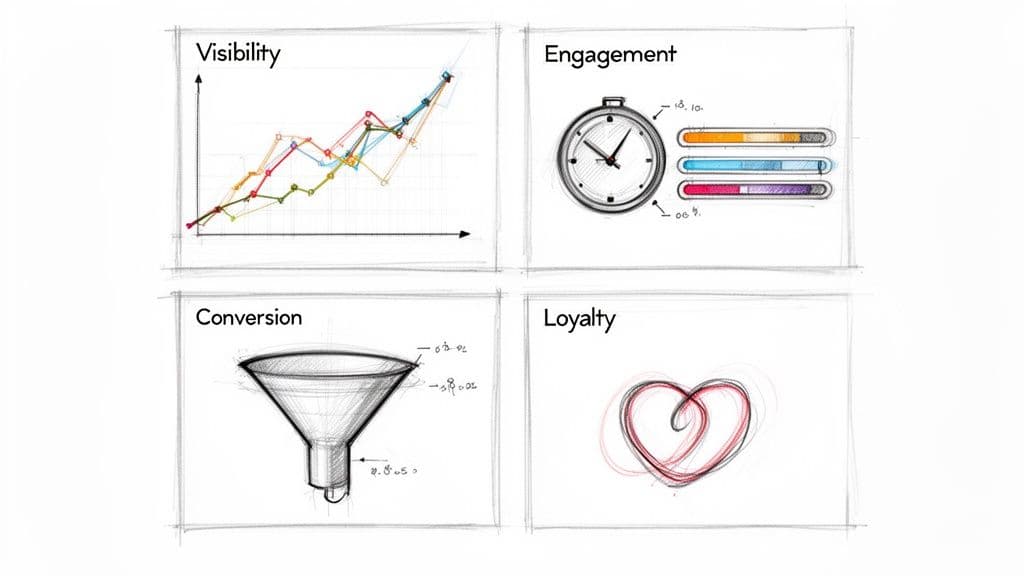
Once you have your data sources connected, the next step is organization. A cluttered dashboard is just as useless as scattered data. The most effective approach is to structure it around the four pillars we’ve been discussing: Visibility, Engagement, Conversion, and Loyalty. This framework ensures you’re always seeing a balanced picture of performance.
A great dashboard tells a story that flows from top to bottom. It should immediately answer high-level questions like "Are we being seen?" and then allow you to drill down into specifics like "Is what they're seeing driving action?"
Consider organizing your dashboard into distinct sections or pages. This creates a visual hierarchy that makes the information much easier to digest, especially for stakeholders who aren't living in the data every day.
Here’s a practical layout you can adapt:
- 1. Visibility Snapshot (Top-Level): This is the first thing anyone sees. It answers: Is our content reaching our target audience?
- Organic Traffic (from Google Analytics)
- Keyword Rankings for top 10 terms (from Search Console)
- Impressions vs. Clicks (from Search Console)
- Share of AI Voice (from Attensira)
- 2. Engagement Deep-Dive (Mid-Level): This section shows how people are interacting. It answers: Are people actually connecting with our content?
- Average Engagement Time per page
- Top 5 Engaging Pages
- Scroll Depth for key articles
- Bounce Rate on primary landing pages
- 3. Conversion & Revenue Impact (The Bottom Line): This is where you prove ROI. It answers: Is our content driving business results?
- MQLs from Content (from your CRM)
- Landing Page Conversion Rates
- Content-Influenced Pipeline (from your CRM)
- Cost Per Lead
By organizing your content performance metrics this way, you create an intuitive flow that mirrors the actual customer journey. It allows anyone, from a content strategist to a CMO, to quickly grasp the full impact of your efforts and turn your data into a true strategic asset.
Turning Performance Insights Into Action
Let's be blunt: tracking content performance metrics is a waste of time if you don't do anything with the information. Data can tell you what's broken, but it’s your strategy that has to fix it. Real growth happens when you turn those numbers into a feedback loop of analysis, testing, and improvement.
This whole process starts by asking the right questions when a piece of content isn't hitting the mark. Let's run through a classic scenario to see how this plays out in the real world.
Scenario: High Engagement, Low Conversions
Picture this: your latest blog post is on fire. It's pulling in tons of traffic, and people are spending a lot of time on the page. The only problem? Almost no one is clicking your call-to-action to request a demo. Your dashboard is screaming that you’ve captured attention, but you’re failing to drive action.
Here’s how you can break down the problem and find a solution:
- Analyze the Mismatch: The data shows a clear gap between how interested your readers are and their willingness to convert. Does the call-to-action (CTA) even match the content? A deep, technical article that’s very top-of-funnel probably isn't the right place to push for a demo. Your audience is there to learn, not to get a sales pitch.
- Form a Hypothesis and Test It: Time for an educated guess. Maybe a softer CTA would work better, something like downloading a related ebook or signing up for a technical webinar. This approach offers more value upfront and respects the reader's mindset at that moment.
- Implement and Measure: Make the change. Swap out the "Request a Demo" button for an offer to download that high-value content asset. Now, you watch the lead generation rate for this new offer over the next month. The goal is simple: see if it outperforms the original.
A winning content strategy isn’t about hitting a home run on the first try. It’s about using metrics to quickly spot what isn't working, making a smart change, and measuring the impact. This cycle is the heart of data-driven marketing.
You can apply this same thinking to just about any content challenge. For instance, what if a competitor is dominating AI search results for one of your core topics? You'd fire up a tool like Attensira to dissect their content structure, find the gaps, and build a far more comprehensive article designed to become the definitive source for AI models.
At the end of the day, your content performance metrics aren't just a report card—they're a roadmap. Every data point is a signpost pointing you toward your next move. If you listen to what they're telling you, you can systematically refine your strategy, breathe new life into older content, and ensure every single piece you publish works hard for your business.
Got Questions About Content Metrics? We've Got Answers.
Diving into content performance can feel like you're trying to read a new language. Let's clear up some of the most common questions so you can stop guessing and start turning your data into a real-world advantage.
KPI vs. Metric: What's the Real Difference?
It’s easy to use these terms interchangeably, but they represent two very different things.
Think of a metric as any data point you can count—page views, time on page, social shares. They're all just raw numbers.
A Key Performance Indicator (KPI), on the other hand, is a metric you've hand-picked because it directly measures your progress toward a critical business objective. It’s the metric that tells you if you're actually winning.
For instance, "organic traffic" is a metric. But "increasing organic traffic to our solutions pages by 20% this quarter" is a KPI. See the difference? All KPIs are built from metrics, but only the ones that truly define success get to be called KPIs.
How Often Should I Actually Check My Content Performance?
There's no single right answer here—it all comes down to what you're trying to learn from the data.
- Weekly: A quick pulse-check on high-level metrics like organic traffic and impressions is a good idea. This helps you spot big swings or technical glitches before they become major problems.
- Monthly: This is the sweet spot for digging into engagement and conversion metrics. A month's worth of data is usually enough to see real patterns and understand what's connecting with your audience.
- Quarterly: Save your big-picture, business-impact metrics for this review. Looking at things like content-influenced revenue on a quarterly basis aligns your content strategy with the company's broader financial and planning cycles.
My CTR Dropped After AI Overviews Rolled Out. What Now?
If you're seeing your click-through rate fall while your impressions are rising, you're not alone. This is a classic sign that your content is being featured in AI Overviews, giving users the answer right on the search results page.
The game has changed. Instead of fighting for the click, your new goal is to own the answer. You want to be the authoritative source the AI cites, building brand recognition and trust even if the user never visits your site.
Focus your energy on creating incredibly thorough, well-structured content that answers questions so well that Google's AI can't ignore it. For a deeper dive into this and other measurement challenges, this guide on how to measure content performance for real results is an excellent resource.
Ready to see how your brand shows up in the new world of AI search? Attensira gives you the tools to track your presence in AI Overviews and other generative results, translating messy data into clear actions. Find out exactly where you stand and how to optimize your content by visiting https://attensira.com.