
Discover how calculating share of voice reveals your market stand. Learn simple methods, tools, and AI-driven insights to outpace competitors.
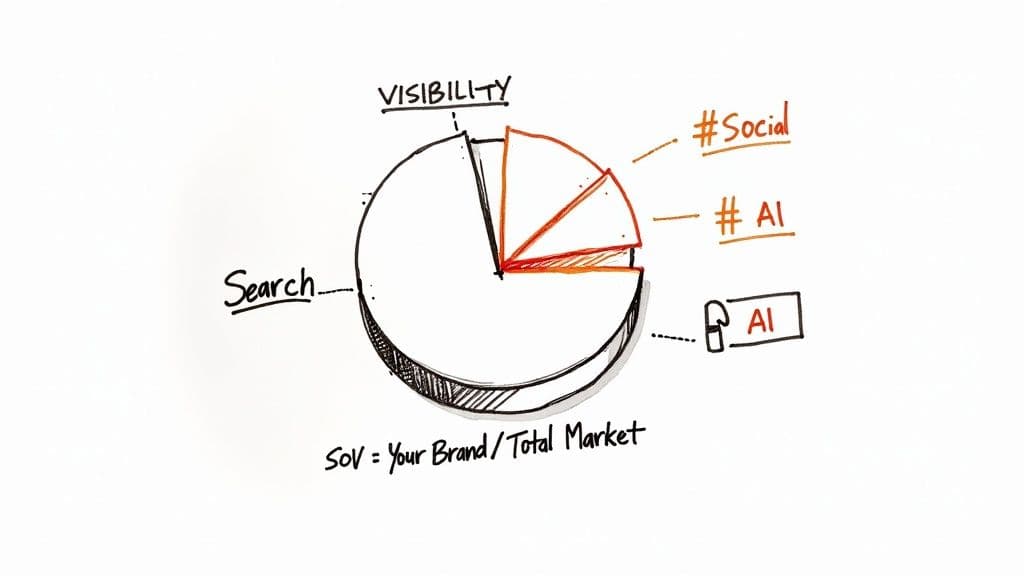
At its core, calculating share of voice is a pretty simple idea: you divide your brand's visibility by the total market's visibility for a specific channel. The resulting percentage tells you how much of the conversation you actually own compared to your competitors. It's a metric that goes way beyond ad spend to capture your real footprint in organic search, social media, and now, even in AI-driven answers.
What Share of Voice Looks Like Today
The fundamental formula doesn't really change, but the data you plug into it will vary dramatically depending on the channel you're measuring.
For years, SOV was a straightforward exercise in comparing advertising budgets. This classic approach made it easy to link media investment directly to competitive visibility, and for a great primer on this, you should check out What Is Share of Voice and How Do You Win It.
The old-school calculation was simply your ad spend divided by the total ad spend for your category. For example, if your company spent 5,000,000** on advertising in a market where competitors collectively spent **100,000,000, your SOV was a clean 5%.
This model worked perfectly for decades, especially in big markets where firms like Nielsen tracked total ad expenditures. It gave media planners a clear benchmark to decide if they were investing above or below their actual market share—a time-tested rule of thumb.
Moving Beyond Ad Spend
But let's be real—the conversation is no longer confined to paid ads. It’s fragmented across countless digital touchpoints, and a simple budget comparison just doesn't tell the whole story anymore. A brand's true influence is now a composite of a much wider spectrum of interactions.
To get an accurate SOV measurement today, you have to account for this new reality. It's about quantifying your presence wherever your audience is paying attention. That means looking at everything from:
- Organic Search: How often do you show up when people search for relevant terms?
- Social Media: What slice of the industry conversation actually mentions your brand?
- Content & PR: How frequently are you being cited in articles, blogs, and news?
- AI Responses: Is your brand popping up in the answers from large language models?
This modern definition elevates SOV from a simple media-buying metric to a vital sign of your overall brand health and authority. It gives you a much truer picture of where you stand in a customer's mind, not just on an advertising spreadsheet.
Why You Need the Full Picture
Taking this holistic approach is non-negotiable because visibility on one channel almost always bleeds into another. A strong organic search game can spark conversations on social media, just as a killer PR campaign can drive a surge in branded searches. When you measure across all these channels, you get a multi-dimensional view of your competitive standing.
A high share of voice in paid ads can easily mask a critical weakness in organic search. A comprehensive calculation is the only way to avoid operating with a massive strategic blind spot.
Ultimately, the goal is to build a composite score that reflects your genuine market presence. This allows you to allocate resources far more intelligently. To dig deeper into how these metrics influence each other, it’s worth understanding the dynamic between share of market vs. share of voice. By tracking both, you can build a more resilient and impactful brand strategy.
Building Your SOV Data Collection Toolkit
An accurate share of voice calculation hinges entirely on the quality of the data you feed it. To move from theory to practice, you need to assemble a reliable toolkit that captures visibility metrics across every channel where you're vying for attention. This usually means a smart mix of traditional data sources and modern analytics platforms.
The classic starting point has always been paid media. For years, companies relied on sources like Nielsen for market-level ad spend data, making for a pretty straightforward, budget-based SOV calculation. Today, we get much more direct insights. Take Google Ads, for example—its impression share metric is essentially a real-time SOV for your paid search campaigns.
This number tells you what percentage of all possible impressions your ads actually received. If your impression share is 40%, you know for a fact that competitors are scooping up the other 60%. It’s a clean, direct, and incredibly actionable measure of your paid visibility.
Expanding to Organic and Social Channels
While paid metrics are neat and tidy, the real challenge in calculating share of voice comes from earned and owned channels. For these, you’ll need specialized tools built to analyze huge volumes of unstructured data.
Platforms like Semrush and Ahrefs are indispensable for measuring your organic search footprint. They do more than just track keyword rankings; they actually estimate a visibility score based on ranking positions and search volume across a defined set of keywords. This lets you precisely benchmark your organic presence against your key rivals.
When you turn to the social media world, listening tools become your best friend. Platforms such as Brandwatch or Sprout Social are designed to track brand mentions, hashtags, and important conversations across all the major networks. They quantify the chatter around your brand versus the competition, giving you the raw data needed for your social SOV.
Here’s a pro tip from the trenches: don’t just settle for raw mention counts. The best tools can analyze the sentiment and potential reach of each mention. This lets you calculate a far more nuanced "quality" share of voice, not just a simple volume metric.
Unifying Data with Modern Platforms
The biggest hurdle most teams face is stitching together data from all these separate sources into one coherent story. This is where modern AI-powered platforms and integrated analytics solutions make a world of difference. They're designed to give you a unified view of your brand’s presence by pulling in data from search, social, PR, and even new frontiers like AI-generated search results.
A really solid toolkit often blends specialized, best-in-class tools with an all-in-one solution that ties everything together. For a deeper look at your options, our guide on brand awareness measurement tools provides a detailed comparison to help you build the right stack for your goals.
Ultimately, you want to create a central dashboard that aggregates these different visibility metrics. This is what allows you to see how a spike in PR mentions might lift your organic search visibility, or how a competitor’s new ad campaign is affecting your share of the social conversation.
Choosing the Right Tools for Your Goals
There’s no "one-size-fits-all" solution here. The tools you choose should depend entirely on your channels, budget, and what you’re trying to measure. A small B2B company might obsess over organic search and LinkedIn, while a massive consumer brand needs to monitor everything from TikTok to broadcast TV.
To help you get started, it's useful to think about tools in categories based on what they do best.
Comparison of SOV Data Collection Tools
This table breaks down the main types of tools you'll encounter, what they cover, and where they really shine. It’s a good starting point for evaluating which platforms align with your specific measurement needs.
By thoughtfully selecting a toolkit that matches where your audience actually spends their time, you can build a powerful data collection engine. This engine becomes the backbone of your strategy, giving you the reliable metrics needed to calculate share of voice accurately and make the right moves to grow your market presence.
Calculating SOV Across Key Digital Channels
Once you've got your data sources lined up, the real work begins: turning raw numbers into a clear picture of your brand's presence. Calculating share of voice isn't a one-size-fits-all formula. The right approach depends entirely on where you're competing for attention—whether that's in social media feeds, on a crowded retail marketplace, or in organic search results.
Let’s get practical and walk through how to crunch the numbers for these three critical battlegrounds.
The process itself is straightforward. You gather the right metrics for the channel, use your tools to analyze the competitive landscape, and then run the calculation.
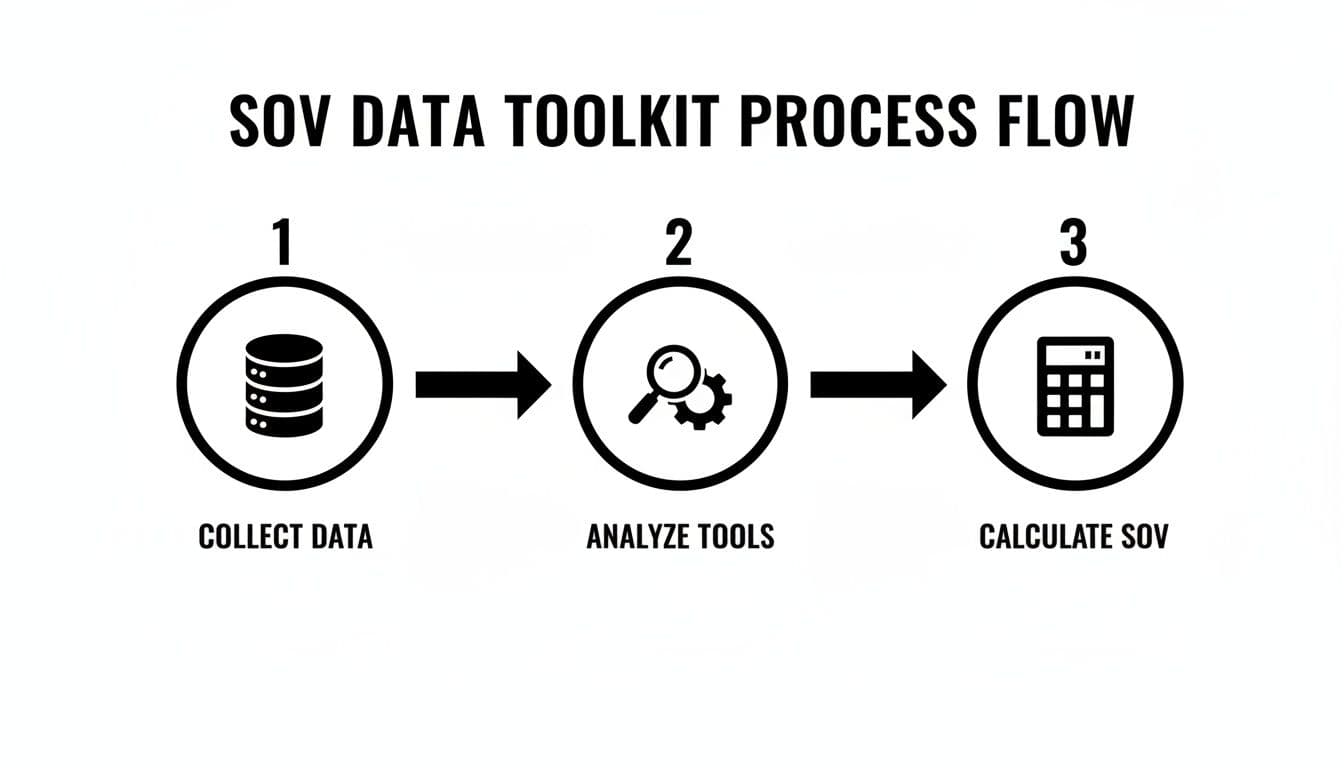
This highlights a key truth: your final SOV number is only as reliable as the data you put into it. Garbage in, garbage out.
Social Media Share of Voice
On social media, share of voice is all about the conversation. You're measuring how much of the chatter in your industry revolves around your brand. This usually involves tracking brand mentions, key hashtags, and sometimes even impressions across platforms like X (formerly Twitter), Instagram, or LinkedIn.
The formula is elegantly simple:
Social SOV = (Your Brand Mentions / Total Market Mentions) x 100
"Total Market Mentions" is just the sum of your mentions and those of the competitors you're tracking.
Imagine a B2B software company, "Innovate Inc.," wants to see how it stacked up against three rivals in July. They use a social listening tool and pull the following numbers:
- Innovate Inc. Mentions: 4,500
- Competitor A Mentions: 6,200
- Competitor B Mentions: 3,800
- Competitor C Mentions: 2,500
First, find the total size of the conversation: 4,500 + 6,200 + 3,800 + 2,500 = 17,000 mentions.
Now, plug Innovate Inc.'s number into the formula: (4,500 / 17,000) x 100 = 26.5% SOV. This gives them a clear benchmark of their conversational market share. When you're pulling data, remember that metrics like impressions matter, too. For a deeper look into that, check out this great guide on understanding LinkedIn impressions.
Retail Media Impression Share
When you shift to e-commerce platforms like Amazon or Walmart, the game changes. Here, SOV is often measured as impression share for sponsored products and ads. It tells you what slice of the digital shelf space you're actually capturing for specific keywords.
The formula looks familiar, just with a different metric:
Retail Media SOV = (Your Brand Impressions / Total Category Impressions) x 100
Let's say a home goods brand, "Cozy Living," is running ads for their top product. They want to know their visibility for the term "memory foam pillow" over one week.
The platform's ad console gives them this data:
- Cozy Living Impressions: 150,000
- Total Available Impressions for the Keyword: 800,000
The calculation is: (150,000 / 800,000) x 100 = 18.75% SOV.
This tells the Cozy Living team that their ad appeared in roughly one out of every five relevant searches. More importantly, it shows them there's a huge 81.25% of the market they aren't reaching, signaling a clear opportunity to adjust bids or optimize their product listings.
Organic Search Visibility
For organic search, SOV is more nuanced than just counting mentions. It's about your share of potential traffic, which means you have to factor in keyword search volume and ranking position. Most SEO platforms (Semrush, Ahrefs) have a "Visibility Score" that automates this, but it's worth knowing how to calculate it manually.
The goal is to measure your slice of the traffic pie for a specific set of keywords.
Organic SOV = (Your Brand's Estimated Clicks / Total Estimated Clicks for All Competitors) x 100
Let's take a cybersecurity firm tracking its performance for a handful of high-value keywords. They need to estimate traffic by multiplying each keyword's search volume by the average click-through rate (CTR) for their ranking position.
Here’s a simplified look at the math:
In this scenario, the total potential clicks are 2,100 (yours) + 3,200 (your competitor's) = 5,300.
Your Organic SOV = (2,100 / 5,300) x 100 = 39.6%.
This method is far more insightful than just tracking rankings because it weights keywords based on their actual traffic potential. While mastering these channels is crucial, don't forget about emerging platforms. We've got you covered there, too; check out our guide on https://blog.attensira.com/how-to-track-your-brands-visibility-in-chatgpt-other-top-llms.
Refining Your Analysis with Advanced Techniques
A raw share of voice percentage is a great starting point, but it often lacks the context you need to make truly strategic decisions. To turn a simple score into a powerful diagnostic tool, you have to add more sophisticated layers of evaluation. It’s time to move beyond basic mention counts and impression shares to methods that account for the quality and context of your brand's visibility.
This refinement is about calculating a share of voice that reflects what’s actually happening in the real world. After all, not all visibility is created equal.
Applying Weighting for Deeper Insight
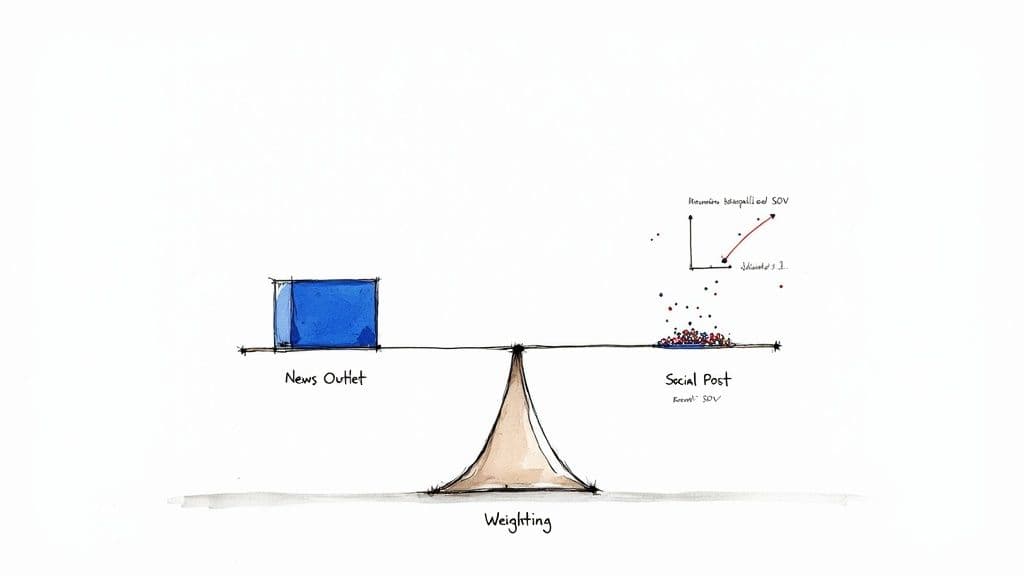
The concept of weighting is simple but profound: assign more value to mentions from high-authority sources. A feature in a major industry publication obviously holds more sway than a random social media post. By applying multipliers to different mention types, you can calculate a Weighted SOV that more accurately reflects your brand's real influence.
Your weighting model can be as simple or as complex as you need it to be. A straightforward approach might look something like this:
- Top-Tier Media Mention: 5x multiplier
- Industry Blog Post: 3x multiplier
- Social Media Mention (Verified User): 2x multiplier
- Social Media Mention (Standard User): 1x multiplier
Let’s say your brand got 100 mentions. Without weighting, they all count the same. But apply the model above, and the picture changes dramatically. One feature in a top publication now carries the same weight as 5 standard social posts, which aligns your metric far more closely with actual brand impact.
Normalizing Data for Accurate Comparisons
Another crucial technique is normalization, which is essential for making fair, apples-to-apples comparisons over time. Markets aren’t static. They fluctuate due to seasonality, major industry events, or shifts in the competitive landscape. Normalization adjusts your data to account for these outside variables.
For instance, a retailer will see a massive spike in total market mentions during the holiday season. If you don't normalize for that, your SOV might look like it dropped in January, even if your performance relative to competitors held strong.
The goal of normalization is to isolate your performance from market noise. It helps you answer the question, "Did our share of voice change because of our actions, or because the entire market shifted?"
To normalize your data, you can benchmark it against a baseline period or a broader market index. This process ensures that a 15% SOV in a quiet month is actually comparable to a 15% SOV during a peak season, giving you a much truer read on your strategic progress.
Tracking Brand Visibility in AI Responses
The newest frontier for share of voice is monitoring how your brand shows up in AI-generated content. As more people turn to AI chat for answers and product summaries, making sure your brand is represented accurately—or at all—is mission-critical. This requires a fresh approach to both data collection and analysis.
Platforms like Attensira are built specifically to track how your brand and competitors appear in the responses of major AI models. This isn't just about counting mentions; it's about digging into the context and sentiment of those appearances.
When you're analyzing AI visibility, these are the key questions you need to answer:
- Presence: Is your brand even mentioned when a user asks for recommendations in your category?
- Positioning: When you are mentioned, is your brand framed as a leader, an alternative, or just another option in a long list?
- Attribution: Does the AI correctly credit key features or innovations to your brand, or does it mistakenly give them to a competitor?
- Sentiment: Is the language the AI uses to describe your brand positive, neutral, or negative?
Because AI models pull information from countless online sources, your visibility there is a direct reflection of your broader digital footprint. A weak presence in AI responses often points to underlying weaknesses in your SEO, content, and PR strategies. By actively tracking this channel, you get a leading indicator of your brand’s authority and can take targeted action to improve how you are perceived by these powerful new gatekeepers of information.
Avoiding Common Pitfalls in SOV Measurement
Calculating share of voice gives you a fantastic snapshot of your competitive standing, but it’s a process riddled with potential landmines. Even a seemingly minor mistake in how you set things up can ripple through your entire analysis, leading you to make strategic calls based on a warped view of the market. Trustworthy analysis starts with knowing what these common traps are and steering clear of them.
One of the easiest mistakes to make right out of the gate is working with a poorly defined or incomplete competitor list. It’s natural to zero in on the one or two big players you clash with daily, but that often means you're completely missing the emerging disruptors or niche specialists quietly eating into your audience. Your SOV will look deceptively high if you're only measuring it against a conveniently small sliver of the actual competitive landscape.
Overlooking the "Why" Behind the Numbers
Another huge pitfall is treating all visibility as good visibility. A raw SOV percentage doesn't tell you anything about the quality or context of the conversation. Are people talking about your brand to celebrate a new product, or are they fired up about a massive service outage? Ignoring sentiment is like measuring the noise level in a room without actually listening to what anyone is saying.
A high SOV driven by negative press is a vanity metric, plain and simple. It hides a serious reputation problem under a seemingly positive number. To get a real read on your brand's health, you have to segment your analysis. I always recommend calculating your "Positive SOV" and "Negative SOV" as separate metrics—it tells a much more honest story.
This is especially true in retail media, where even small shifts in visibility can directly impact the bottom line. For example, grabbing a 30% impression share on a major retail site for a key product category is a power position that directly influences clicks and sales. Brands that manage to bump their retail-media SOV by just 5–10 percentage points during peak seasons often see a very real, measurable lift in sales. You can dig deeper into this relationship in Pacvue’s guide to retail media SOV.
Keeping Your Data Clean and Consistent
Mixing and matching different types of metrics is another surefire way to get a meaningless result. You just can't combine ad spend dollars with organic impression counts in the same formula and expect it to make sense. It’s a classic apples-and-oranges problem that will only give you a number that looks official but means nothing. Stick to consistent metrics within each channel you analyze.
This screenshot from Pacvue shows exactly how retail media platforms provide the kind of granular, consistent data you need for a clean SOV calculation.
You can see how the dashboard breaks out spend, impressions, and sales—this allows for a direct, apples-to-apples comparison of impression share against your competitors, all within the same ecosystem.
Finally, you have to validate your data. Always. Your analysis is only as strong as the numbers you start with. Don't just blindly trust the output from a tool without running a few basic sanity checks.
A critical part of calculating share of voice is having a healthy dose of skepticism. If a number looks wildly off, it probably is. Investigate anomalies before you present them as fact.
Here are a few quick validation checks I always run:
- Cross-Reference Your Sources: If you can, pull data from two different tools (like Semrush and Ahrefs for organic search). Do the overarching trends look similar?
- Spot-Check the Raw Data: Take a small sample of the mentions or impressions being counted and review them manually. Are they actually relevant? Is the sentiment being tagged correctly?
- Run a Plausibility Test: Does your SOV make sense when you look at other business metrics? If your share of voice supposedly doubled last quarter but your website traffic and sales were flat, something in your calculation is likely broken.
By being proactive about these common issues, you can build real confidence in your SOV numbers. This turns the metric from a potential source of misinformation into a truly reliable guide for your brand strategy.
Common Questions About Calculating Share of Voice
Even with a solid plan, calculating share of voice always kicks up a few tricky questions. Getting these details right is what separates a basic report from a competitive assessment that actually drives growth.
Let's dig into some of the most frequent questions I hear from teams trying to nail down their SOV analysis.
How Often Should I Calculate Share of Voice?
The right cadence really depends on the pulse of your market. There's no one-size-fits-all answer.
If you're in a fast-paced space like e-commerce or consumer tech, things change in a flash. Competitors launch campaigns, and conversations shift overnight. Here, a weekly or bi-weekly calculation is almost essential to stay agile and responsive.
On the other hand, for more traditional B2B industries with longer sales cycles, a monthly or even quarterly analysis usually makes more sense. This gives you a strategic, high-level view of trends without getting lost in the day-to-day chatter. The most important thing is to establish a consistent rhythm that works for your planning cycle.
What Is a Good Share of Voice to Aim For?
This is the million-dollar question, and the answer is always: it depends. There's no magic number. A "good" SOV is entirely relative to your market position and your ambitions.
A dominant market leader might be fighting to protect its 30-40% SOV, while an up-and-coming challenger brand would see hitting 15% as a massive victory. It’s all about context.
A useful rule of thumb is to look at the relationship between your Share of Voice (SOV) and your Share of Market (SOM). If you want to grow, your SOV needs to be greater than your SOM.
Think of it this way: a brand with a 10% market share but a 15% share of voice is actively investing in its future growth. That extra 5% puts pressure on the competition and signals to the market that you're making a move.
Instead of chasing a universal benchmark, focus on consistently outpacing your direct competitors and achieving steady, incremental growth.
How Can I Calculate SOV on a Limited Budget?
You don't need a massive enterprise software budget to get started. When money is tight, you just have to get scrappy and focus your efforts on the one or two channels where your audience lives.
- Brand Mentions: Set up Google Alerts for your brand name and your top competitors. It’s free and surprisingly effective for tracking mentions across the web.
- Organic Search: Many SEO platforms have free-tier plans that let you track your visibility for a small, core set of keywords. It's a great starting point.
- Social Media: Don't underestimate a manual search. Running searches on platforms like X (formerly Twitter) or LinkedIn can give you a rough-but-useful snapshot of mention volume.
This focused approach won't give you the whole picture, but it provides valuable directional data to start benchmarking your performance without a big investment.
How Does Negative Sentiment Affect My SOV?
This is a critical point. A standard SOV calculation is blind to sentiment—it only measures volume. A huge spike in your SOV could be from a PR crisis or a wave of customer complaints, which is a dangerous vanity metric. It tells you people are talking, but it doesn't tell you why.
To get a real sense of brand health, you need to look at Sentiment-Adjusted SOV. Most social listening tools can automatically classify mentions as positive, neutral, or negative. This lets you report on your "Positive SOV" separately from your "Negative SOV," revealing the true quality of the conversation around your brand, not just its size.
Understanding and shaping your brand's visibility in this new AI-driven era is no longer optional. Attensira provides the specialized tools you need to track how your brand appears in AI responses, giving you the insights to refine your strategy and secure your share of voice on the next frontier of search. Discover how you're seen by AI at https://attensira.com.